Definition of ‘Stochastic Oscillator’

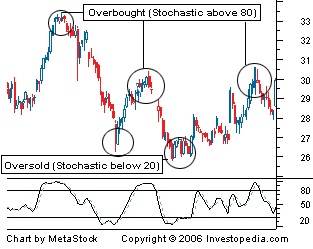
A technical momentum indicator that compares a security’s closing price to its price range over a given time period. The oscillator’s sensitivity to market movements can be reduced by adjusting the time period or by taking a moving average of the result. This indicator is calculated with the following formula:

%K = 100[(C – L14)/(H14 – L14)]

C = the most recent closing price
L14 = the low of the 14 previous trading sessions
H14 = the highest price traded during the same 14-day period.

%D = 3-period moving average of %K

Stochastic Oscillator

Investopedia explains ‘Stochastic Oscillator’

The theory behind this indicator is that in an upward-trending market, prices tend to close near their high, and during a downward-trending market, prices tend to close near their low. Transaction signals occur when the %K crosses through a three-period moving average called the “%D”

Click Here to see all Intermediate Stock Trading Articles


The Inner Game

Retail price: $22.95
Amazon Price: $17.98

A good summary of the psychological profile necessary for consistent profitability in trading. The strength of this book is that it is telling the story as it is – not everyone can become a great trader but it is possible to train anyone in becoming a good one as long as the person is willing to shape their minds into one. This is, however, also the weakness of the book as it can offend many people who think they know better.

From the Back Cover

Here’s what they said about this excellent work: “The Innergame of Trading is excellent. In understandable language, it takes trading psychology to new levels with its focus on self-improvement and the winner’s state of mind. It clearly instructs how to think, what to do and when to do it.”-Marshall J. Stein, Vice President, Rand Financial Services, Governor, Chicago Mercantile Exchange. “This book provides a unique insight into the thought process involved in successful trading. Anyone considering trading or already involved in trading can benefit from reading this book.”-Bruce Johnson, President, Packers Trading Company, Inc. “The chapter concerning the psychological aspects of charting is the most insightful one I have studied… I wholeheartedly recommend this book to up-and-coming traders.”-Jeff Silverman, Governor, Chicago, Mercantile Exchange. “I’m trading more relaxed and anxiety-free than ever before. I can’t thank you enough for what your program has meant to me.”-Phil Flynn, Trader, Alaron Trading Corp, “Extremely insightful. No other book available on the futures markets takes such an in-depth look into the psychological complexities of trading… I would recommend every trader read this book, regardless of experience.”-Bruce Wisner, Trader, Global Investment Services.

Review

This book claimed to be a book on trading psychology. My take is that it is a concise summary of the necessary ingredients for a trader to walk the path in becoming successful. Unlike most of the trading psychology books that focus on the explanations, this book is a reflection workbook.

Throughout the book, it asks the readers to reflect, to organize their thoughts and to evaluate themselves. The goal obviously is to drive the readers to prepare themselves into seeing more clearly where they stand technically and psychologically. Then the target (or ideal) conditions are named as a comparison so that the readers can set their sight on a path to take themselves from where they are to where they suppose to be.

Several big guns are interviewed in the book with their personal takes on how to become a successful trader. This part simply re-enforce the theme of the book in case the readers are not convinced.

I have seen extremely different reactions to this book. There are those who love it so much they model their own game plan based on the book to change themselves into better traders.

There are also people who hate this book so much that they say it is completely useless. It is understandable because the book strikes a core belief conflict into these readers. Many people believe that if they have a perfect trading system they will make money without skills, psychology make up, and much less character.

A good book even though it is written many years ago. It can be difficult to understand the book if you are not doing the exercise along the way. I recommend this book to those who are willing to work on their psychology to improve their trading performance.

StockWiz is a stock software that specializes in data mining and screening. StockWiz has very flexible querying capabilities that can come in the ranking, screening or backtesting a trading strategy. Compared to other stock software products this program has some excellent features. The real strength of this software package is its searching and scanning capabilities when trying to locate U.S. stock that are worthy of trading. If the user plans to become proficient in the StockWiz formula and will be customizing and trading their own strategies then this is a package that should be given a test drive. StockWiz is a subscription-based model charging $19.95 on a monthly basis and $199.95 on an annual basis.

StockWiz Features in a Nutshell

  • Advanced Screening: Methodically search all US publicly traded companies for companies that meet your technical analysis, mathematical analysis and fundamental analysis criteria. Your screening can totally be customized with the help of the StockWiz formula language. Use the formula language to define your own calculations and then use the results in your screening.
  • Rank all companies: Rank all US publicly traded companies in an unlimited number of ways. Design your own reports with the top 20, 50 or 100 companies and pass them to your friends. Why just follow the 5 or 10 reports found in the daily newspapers?
  • Compare Industry Groups:StockWiz allows you to define an unlimited number of company groups. You can then very easily compare those groups and find the best performing industry, the worst performing, etc.
  • Back-testing made easy: Before you even place your money in the stock market, StockWiz allows you to play “what If I had invested” scenarios. In that way, you can see how a trading method would have performed. So, testing before investing is now easy.
  • Advanced Charting: Use StockWiz to produce many different types of charts. But instead of you looking at charts one after the other, just tell the program what conditions you are looking for, and let the program find all companies that meet your criteria!

What’s new in StockWiz 5

Here are some of the new features

  • We are using a new database engine – so daily updates now take less than a minute
  • There is only one “database” that contains both stocks and indices. By no longer using multiple database the use does not need to know or worry about databases. And by having stocks and indices (and anything else) in the same database, the user can easily mix indices and stocks in the same calculations.
  • We came up with a new formula language and retired the old formula language that was used in StockWiz 3 and StockWiz 4. The new formula language is like a spreadsheet formula language with the only exception that each operation is not on a single cell but on a single column.
  • All modules of StockWiz 5 are better tied together in terms of user interface.
  • StockWiz 5 can now harvest historical dividends and Earnings Per Share from Yahoo Finance(a free web site). StockWiz 5 can also harvest historical stock prices from Yahoo Finance and even allows you to compare those prices to the StockWiz historical stock prices.

The-Intelligent-InvestorTechnical Analysis Explained : The Successful Investor’s Guide to Spotting Investment Trends and Turning Points

Retail price: $22.95
Amazon Price: $15.15

This classic text is annotated to update Graham’s timeless wisdom for today’s market conditions…

The greatest investment advisor of the twentieth century, Benjamin Graham, taught and inspired people worldwide. Graham’s philosophy of “value investing” — which shields investors from substantial error and teaches them to develop long-term strategies — has made The Intelligent Investor the stock market bible ever since its original publication in 1949.

Over the years, market developments have proven the wisdom of Graham’s strategies. While preserving the integrity of Graham’s original text, this revised edition includes updated commentary by noted financial journalist Jason Zweig, whose perspective incorporates the realities of today’s market, draws parallels between Graham’s examples and today’s financial headlines, and gives readers a more thorough understanding of how to apply Graham’s principles.

Vital and indispensable, this HarperBusiness Essentials edition of The Intelligent Investor is the most important book you will ever read on how to reach your financial goals.

Technical analysis explainedTechnical Analysis Explained : The Successful Investor’s Guide to Spotting Investment Trends and Turning Points
Retail price: $59.95
Amazon Price: $31.83

Recommended for professional certification by the Market Technician’s Association, this is the Original – and Still Number One – Technical Analysis Answer Book. “Technical Analysis Explained, 4th Edition”, is today’s best resource for making smarter, more informed investment decisions. This straight-talking guidebook details how individual investors can forecast price movements with the same accuracy as Wall Street’s most highly paid professionals, and provides all the information you will need to both understand and implement the time-honored, profit-driven tools of technical analysis.Completely revised and updated for the technologies and trading styles of 21st century markets, it features: technical indicators to predict and profit from regularly occurring market turning points; psychological strategies for intuitively knowing where investors will seek profits – and arriving there first!; and, methods to increase your forecasting accuracy, using today’s most advanced trading techniques.Critical acclaim for previous editions include: “One of the best books on technical analysis to come out since Edwards and Magee’s classic text in 1948…Belongs on the shelf of every serious trader and technical analyst. ” – “Futures”. “…”Technical Analysis Explained” [is] widely regarded as the standard work for this generation of chartists.” – “Forbes”.Traders and investors are creatures of habit who react – and often overreact – in predictable ways to rising or falling stock prices, breaking business news, and cyclical financial reports. Technical analysis is the art of observing how investors have regularly responded to events in the past and using that knowledge to accurately forecast how they will respond in the future. Traders can then take advantage of that knowledge to buy when prices are near their bottoms and sell when prices are close to their highs. Since its original publication in 1980, and through two updated editions, Martin Pring’s “Technical Analysis Explained” has showed tens of thousands of investors, including many professionals, how to increase their trading and investing profits by understanding, interpreting, and forecasting movements in markets and individual stocks.Incorporating up-to-the-minute trading tools and technologies with the book’s long-successful techniques and strategies, this comprehensively revised fourth edition provides new chapters on: candlesticks and one- and two-bar price reversals, especially valuable for intraday and swing traders; expanded material on momentum – including brand new interpretive techniques from the Directional Movement System and Chaunde Momentum Oscillator to the Relative Momentum Index and the Parabolic; expanded material on volume, with greater emphasis on volume momentum along with new indicators such as the Demand Index and Chaikin Money Flow; relative strength, an increasingly important and until now underappreciated arm of technical analysis; application of technical analysis to contrary opinion theory, expanding the book’s coverage of the psychological aspects of trading and investing. Technical analysis is a tool, nothing more, yet few tools carry its potential for dramatically increasing a user’s trading success and long-term wealth. Let Martin Pring’s landmark “Technical Analysis Explained” provide you with a step-by-step program for incorporating technical analysis into your overall trading strategy and increasing your predictive accuracy and potential profit with every trade you make.

Japanese-Candle-SticksJapanese Candlestick Charting Techniques
Retail price: $100.00
Amazon Price: $59.34

A form of technical analysis, Japanese candlestick charts are a versatile tool that can be fused with any other technical tool, and will help improve any technician’s market analysis. They can be used for speculation and hedging, for futures, equities or anywhere technical analysis is applied. Seasoned technicians will discover how joining Japanese candlesticks with other technical tools can create a powerful synergy of techniques; amateurs will find out how effective candlestick charts are as a stand-alone charting method. In easy-to-understand language, this title delivers to the reader the author’s years of study, research and practical experience in this increasingly popular and dynamic approach to market analysis. The comprehensive coverage includes everything from the basics, with hundreds of examples showing how candlestick charting techniques can be used in almost any market.

Elliot waveElliott Wave Principle: Key To Market Behavior
Retail price: $29.00
Amazon Price: $29.00

The Elliot Wave Principle is mostly used by technical analysts in determining the future price movements of stocks, bonds, and commodities. Basically, the Elliot Wave states that future prices can be forecasted in smaller waves or patterns.

A Great Classic for Three Decades: Now In Its 10th Edition, Consider What This “Definitive Text” Offers You Take a moment to look over your books about investing. Have any of them given you a successful method for making profits and reducing risks? Is there even one such book that has proven reliable over the years? Alas, most investors would say “no.” That’s because so few investment books are “classic” in the true sense: For years investors keep buying the book, and they keep using the method to make the most of their opportunities.

Three decades years ago — 1978 — is one of the last times an investment book was written that is worthy of being called “classic.” One of the two men who authored that book was a 26 year-old market analyst working at Merrill Lynch’s headquarters on Wall Street. The young man had earned a lot of attention in a short time by using a forecasting tool that almost no one had heard of. Yet his market forecasts were startlingly accurate: Robert Prechter was the young man’s name, and he used a method called the “Elliott Wave Principle.”

A. J. Frost was one of the few other financial professionals who used the Wave Principle. In a distinguished 20-year career, Frost had likewise made many astonishingly accurate forecasts. His colleagues regarded him as the consummate technical analyst. Frost and Prechter met in May of 1977 and became fast friends. Eighteen months later, they published Elliott Wave Principle – Key to Market Behavior. The Dow Industrials stood at 790. But the brash forecast in this new book called for a Great Bull Market. It became a runaway best seller. Three decades is enough time for investors to deem a book about an investment method as “classic,” and surely the jury is in on this one: Elliott Wave Principle is now published in seven languages, and continues to sell thousands of copies every year.

In Europe, Asia and the Americas, literally millions of investors worldwide use or recognize the Elliott Wave method for profitable investing. Elliott Wave International is proud to present the 10th edition of this investment classic. It’s designed to help the Elliott Wave novice and the veteran practitioner. It’s time to consider what this definitive text offers you. Here’s a sample of what you’ll learn: The basic tenets of Wave Theory: You’ll read simple explanations of the terms, and how to identify all 13 waves that can occur in the movement of stock market averages. The rules and guidelines of Wave analysis: You’ll learn the basics of counting waves, how to recognize the “right look” of a wave, plus lots of simple steps for applying the rules. The scientific background of the Wave Principle: How you can see it in nature and the universe, in art and mathematics, even in the shape of the human body.

Long-term waves: You’ll see how the Wave Principle gives history greater meaning, from the fall of the Roman Empire through the Middle Ages into the financial upheavals of the 20th Century. Understanding these monumental trends will help you position yourself for long-term profit and protection. Stocks, commodities and gold: The Wave Principle is your guide to the movements of any financial market. Few pleasures can match the exhilaration you’ll feel when a Wave Principle forecast has you in the market when it moves up, or takes you out just before it moves down. Obviously, Elliott Wave Principle – Key to Market Behavior is the perfect companion to Bob Prechter’s Elliott Wave Theorist publication. The book is essential reading for you to receive the most from what the Theorist says every month — in fact, all of EWI’s publications continually reference this book.

TheStreet an influential digital financial media outfit whose chain of digital service provides subscribers,  advertisers and users with an array of valuable content and tools by way of online, social media, tablet and mobile channels. Their aim is to supply actionable ideas from the realm of investing, finance and business so you can break down information barriers, and level the playing field in order to help all individuals and organizations grow their resources. TheStreet also offers tools and insights needed to help you make the best decisions regarding your earnings, investments, savings and spending your hard earned money.

Since 1996, TheStreet has been extraordinary from other financial media companies through its journalistic excellence, their unbiased approach and helpful interactive multimedia coverage of the financial markets, economy, industry trends, investment as well as financial planning.

You can check out their website for financial news, commentaries, analysis, ratings. Their website is updated in real time daily to provide timely financial commentary, analysis and investigative journalism.

Another unit of TheStreet is called The Deal. It services corporate deal makers, advisers and institutional investors giving them the most sophisticated analysis of the deal economy. The Deal Pipeline, is managed by senior journalists offering proprietary research and reporting across M&A, bankruptcies, auctions and financing. Their marketing and media groups provide industry’s leading forecasting events.

Check Stockpickr for social networking to help investors by organizing professionals and day traders to share stock ideas and tips. A usable resource, Stockpickr helps the community to evaluate investment decisions with the advantage of group insight through interactive tools like blogs and comparative portfolio ratings.

MainStreet supports personal finance knowledge as well as advice to assist consumers grow their wealth and improve their lives. This website supports consumers nationwide with good local rates on CDs, interest checking, savings accounts, mortgage/home equity, money markets and auto loans.

Technical analysis of the financial marketThe Visual Investor
Retail price: $90.00
Amazon Price: $54.89
This outstanding reference has already taught thousands of traders the concepts of technical analysis and their application in the futures and stock markets. Covering the latest developments in computer technology, technical tools, and indicators, the second edition features new material on candlestick charting, intermarket relationships, stocks and stock rotation, plus state-of-the-art examples and figures. From how to read charts to understanding indicators and the crucial role technical analysis plays in investing, readers gain a thorough and accessible overview of the field of technical analysis, with a special emphasis on futures markets. Revised and expanded for the demands of today’s financial world, this book is essential reading for anyone interested in tracking and analyzing market behavior.

About the Author

John J. Murphy is President of MURPHYMORRIS, Inc., a producer of interactive educational products for technical analysis. A former technical analyst for CNBC and director of Merrill Lynch’s Technical Analysis Futures Division, he is the author of The Visual Investor and Intermarket Technical Analysis.

Trading candlesticksThe Visual Investor
Retail price: $34.99
Amazon Price: $24.29

Traders who use charts to time their moves rely on strong and clear signals. Unfortunately, price levels and traditional technical indicators alone aren’t always reliable. There is a solution: candlestick signs, moves, and patterns. When these visual signs of reversal or continuation are integrated with other signals, they provide the strongest possible entry and exit timing: both the signal and the means for confirming it. In this easy-to-use book, renowned trader Michael C. Thomsett demystifies candlesticks and shows active traders exactly how to use them. In Trading with Candlesticks, Thomsett explains how each leading candlestick works, how they appear, and how to interpret them to discover emerging price moves and trend reversals, as well as confirmations of existing trends. Trading with Candlesticks shows dozens of examples of candlestick signs, moves and patterns in action, explaining them not in isolation, but as part of broader, developing price trends on real stock charts. Thomsett also discusses failed signals, and offers guidelines for identifying the likely impending failure or success of each pattern. While no investing approach is 100% foolproof, Thomsett’s system for recognizing candlestick signals and confirming them with other technical signs makes technical analysis more accurate than it’s ever been before.

Michael C. Thomsett has authored more than 70 financial books, including The Options Trading Body of KnowledgeOptions Trading for the Conservative Investor, Second Edition; “Put” Option Strategies for Smarter TradingWinning with OptionsThe LEAPS Strategist; and the best-selling Getting Started in Options, now in its 8th edition with 250,000+ copies sold. His book The Investment and Securities Dictionarywas named by Choice as an Outstanding Academic Book for 1988. Before starting his professional writing career in 1978, Thomsett was an accountant. He has actively traded options since the mid-1970s.

how to spot market trends - book on technical analysisThe Visual Investor
Retail price: $45.00
Amazon Price: $27.94

The Visual Investor, Second Edition breaks down technical analysis into terms that are accessible to even individual investors. Aimed at the typical investor–such as the average CNBC viewer–this book shows investors how to follow the ups and downs of stock prices by visually comparing the charts, without using formulas or having a necessarily advanced understanding of technical analysis math and jargon. Murphy covers all the fundamentals, from chart types and market indicators to sector analysis and global investing, providing examples and easy-to-read charts so that any reader can become a skilled visual investor.


Publisher Comments:
Visual analysis, also known as technical or chart analysis, is one of the best ways to invest in today’s markets—and it’s not as hard as you might think. This proven approach allows you to follow almost any market, without having to be an expert on any of them, and it can give you an enormous advantage over those who prefer to use some form of economic or fundamental analysis.
With over forty years of market experience and a number of bestselling financial books to his name, John Murphy, one of the world’s foremost technical analysts and educators, knows what it takes to make it in this field. Now, with the Second Edition of The Visual Investor—which has been completely updated for current markets—Murphy shares his invaluable insights on this subject with you.
Written in a straightforward and accessible style, this updated guide will introduce you to “visual” investing by explaining a variety of charting techniques that professionals have used for decades, and shows you how specific visual tools can put you in a better position to successfully trade commodities, currencies, bonds, and stocks in both domestic and global financial markets. With the real-world examples and comprehensive charts found here, you’ll quickly discover how to:
*Tell the difference between markets that are trending and those that are not
*Locate important breakouts or breakdowns
*Spot significant support and resistance levels
*Implement asset allocation and sector rotation strategies through exchange-traded funds and mutual funds
*Utilize moving averages to keep track of trends
*Incorporate essential price patterns into your investment analysis
Along the way, Murphy takes you through the ins and outs of reading price and volume charts that can help you make sensible investment decisions, and highlights how you can track the ups and downs of financial markets by visually comparing charts—instead of relying upon complex mathematical formulas and confusing technical concepts.
Knowing why a market is moving is interesting, but not crucial to investment success. In order to trade profitably, all that really matters is what the markets are actually doing. Visual analysis is the best way to determine this, and with the Second Edition of The Visual Investor as your guide, you’ll learn how to put this effective approach to work for you to enhance the performance of your portfolio. ‘
Praise for The Visual Investor Second Edition:
“John Murphy displays his remarkably broad knowledge of price patterns and intermarket relationships in this concise, up-to-date edition. It is a tour through the most important visual techniques, punctuated with practical, timely examples, including real estate, gold, VIX, mutual funds, and ETFs. Every trader will want to read this.”
—Perry Kaufman, author of New Trading Systems and Methods, 4th Edition and A Short Course in Technical Trading
“John Murphy has surpassed another career milestone. His first book on technical analysis is widely regarded as the industry’s standard, and his second is considered a groundbreaking dissertation on intermarket analysis. So too, The Visual Investor, Second Edition is expected to become a reference guide for technicians and fundamentalists alike, as he has successfully removed the mystique that has shrouded conventional chart analysis by providing a panorama of visual tools and relationships that simplify a heretofore seemingly complex investment approach.”
—Tom DeMark, President, Market Studies Inc.
“Imagine going grocery shopping in the stock market and facing hundreds of canned goods marked candlesticks, chart patterns, and indicators. Murphy pulls from the shelf his favorites, explains them to you, and adds them to your shopping cart. At home, he opens each can and cooks a delicious meal that is not only tasty but profitable as well. The Visual Investor is John Murphy’s cookbook. Read it.”
—Thomas N. Bulkowski, ThePatternSite.com, author of Encyclopedia of Chart Patterns and Encyclopedia of Candlestick Charts
“If investors want to learn how to trade trends, they should study every word of The Visual Investor, Second Edition. Murphy hits the mark again!”
—Michael Covel, author of The Complete TurtleTrader and Trend Following
HowTheMarketWorks is a great platform for beginners to learn more about personal finance and how to use a trading platform. HTMW is simplified and has an unintimidating atmosphere to help beginners be accustomed to the world of finance. Whether you are a Professor looking for a more advanced platform, a student who has a thirst to learn more about the different asset types, or an Investor who is looking to back-test a portfolio in different exchanges, www.stocktrak.com would be the way to go.

Since 1990, Stock-Trak has been identified as the leading provider of virtual finance trading simulations. We are currently powering more than 10,000 high schools and 1,000 universities as their virtual trading platform. We also support more than 65 corporate clients for employee training and customer acquisitions.

Below is a couple of similarities and differences that Stock-Trak offers to augment your virtual trading experience in comparison to HowTheMarketWorks. Should you wish to try Stock-Trak and/or to implement in your learning curriculum, please do not hesitate to contact us here!


Features  HowTheMarketWorkslogo  StockTrakSTlogo2
Service Fee Free! Depends on the type of registration (For more info, please contact us!)
Real-time trading & streaming portfolios
Customer Service
Quotes/Research Tool
Different order types (market, limit, stop, trailing stop orders)
Global exchanges United & Canada More than 40 exchanges across the globe
Custom portfolio currency
Featured products for trading Equities & Mutual Funds Equities, Mutual Funds, Bonds, Options, Futures, Future Options
Career Center
Sharpe, Alpha, Beta Rankings
Class Reports

The Stock Market Game™  has met the challenge of higher education standards within tighter budget restrictions, schools are looking for more effective educational tools that will motivate students as well as support teachers in fortifying lifelong learning skills.

The Stock Market Game™ program is a tool which meets these requirements in a time tested way. This program has assisted educators to improve the learning experience in thousands of classrooms. Teachers have used this program to inspire academic subjects like Math, Social Studies, and Language Arts. Research shows this way of training is important in helping learn how to save and invest in their futures.

Critical thinking, decision-making, cooperation and communication, independent research, saving and investing are some of the essential skills that this program reinforces. Students will utilize internet research as well as news updates, thus making the simulation even more effective in the real marketplace. Even while this fun competitive game play will deliver a great educational experience, you’ll see that the student enjoys learning.

This innovative way of participation helps students enjoy The Stock Market Game™ program while learning more about investing. While they advance they will learn core academic concepts and skills which will help them succeed in the classroom and life.

While building a portfolio, the student will research and evaluate stocks, also making choices based on what they’ve gathered. Teams can trade mutual funds and common stocks from the NYSE and NASDAQ exchanges; earning interest on cash balances, pay interest if buying on margin also pay a commission on their trades. The student needs to understand why and how the market works the way it works and how to calculate their returns they’ll need to do the math.

Teachers noticed an excitement in attendance with this program and actually reduces dropout rates. All student participants in the program benefit with their confidence and self-esteem. They have fun and are learning how their classroom lessons affect the real world.

Today investment professionals move up by constantly testing their insights, confirming their commitment and improving their skills.  The outcome of their commitment is investment success.

Marketocracy integrates research and tracking of Marketocracy Data Service analysts with actual investments lead by the models at Marketocracy Capital Management LLC, an SEC registered investment advisor. The uniqueness of Marketocracy Inc. is rare.

Their training in the investment process is transparent and is easy to follow.  Their analysts will provide unparalleled stock research and selection capability and will manage and watch them constantly. Additionally, MCM will analyze the best performing MDS analysts and will develop targeted investment strategies suited to your specific investment goals and risk tolerances. With this approach, they master the art of investing.

InvestorWords is an onlined financial glossary which contains over 15,000 definitions, assisting millions of individuals comprehend valuable concepts needed to succeed in today’s financial world. The glossary for InvestWords is updated regularly and covers important topics like stocks, bonds, banking, accounting, insurance, and Forex. They also offer the InvestorWords Term of the Day newsletter, usable tips and Q&A resources that visitors are able to access.

StockMarketVideo.com has been a leading provider because of its technical analysis, stock picks, trading videos and an array of trading tools on the Web 2006. StockMarketVideo.com provides its members easy to understand stock trading videos entailing predicted strategies, trends and patterns to help you in your stock picks using technical analysis.

Patrick Hughes, Senior Chart Analyst is an expert in technical analysis and has a strong analytical background. He’s received a considerable following on the web by reason of his aptitude to forecast major turns far in advance, often within minutes. His 20 years of experience in chart analysis as well as being a student of the work of Gann, Michael Jenkins, and several other analysts; Patrick Hughes has proven his track record of locating small and mid cap stocks that offer exceptional gains.

StockMarketVideo.com works hard to bring you honesty, integrity and professionalism. They’re committed to assisting investors with the knowledge and tools to increase your chances of picking winning trades daily. Having professional traders help you daily can be fun, educational and profitable.

Investopedia is one of the Web’s bigger sites focused mainly on investing education. The site’s creators, Cory Janssen and Cory Wagner, started in June 1999 as an unbiased investing resource. Based in Canada the site has becoming a well-respected source for financial information. The site was purchased in 2007 by a U.S. publishing company, Forbes and then resold to ValueClick in 2010.

Investopedia is a useful guide for market analysis, investing education, personal finance as well as offering free trading simulations. An extensive financial dictionary, exam prep materials and active trading strategies for investors are offered.  The Investopedia Definitions features a clear English interpretation of hard to understand terms and concepts. The website now averages over 11 Million Unique Visitors and 40 Million Page views a month. There are numerous articles, dictionary entries and tutorials which cover multiple features in finance and investing.

Investopedia presents interactive tools like its popular stock market simulator. This allows individuals to put together a brokerage account with play money and trade publicly traded stocks with options on the NYSE, NASDAQ, and similar stock exchanges.

They also publish upward of 15 stock analysis pieces daily. The pieces are written by different authors and offers analysis as well as buying recommendations on stocks from all sectors.

Learning finance can be very useful in many ways. It will help you perceive life from a different perspective and help you make better financial decisions. You might love learning finance so much that it can become your field of study! To share this passion that we have with beginners, we created Investing 101. We have compiled a complete market trading course that combines classroom theory, quizzes and hands-on practice. Throughout your learning process, you will have a free unlimited access to Stock-Trak, which is our advanced virtual trading platform. This approach will allow the student to receive theoretical and practical knowledge about trading in the real-world.

What does the course include?

  • Unlimited access to the Investing 101 course, exercises and quizzes
  • Unlimited access to the Stock-Trak trading simulation platform
  • eBook version of Investing 101 (For members: Please send us a message and we will send it to you via E-mail!)
  • Investing 101 support for any theoretical or technical questions about Investing 101
  • 7-Day money back guarantee insurance if you are not satisfied with the product

What does the course cover?

The course is broken down in 10 major topics:

  1. Understanding different investment choices
  2. How the stock market works and what makes it move
  3. Making your first trade
  4. Building your $100,000 portfolio
  5. Now that I own it, when do I sell it?
  6. Fundamental Analysis – Understanding earnings and cash flow
  7. Technical Analysis – Common charting terms
  8. Current Hot Topics in Trading
  9. Introduction to Options
  10. Survivor’s Guide to Success

To see in details what the content of the course, see the course outline by clicking here.

How does it work?

First, you will have to sign up and register for Investing 101. Once registered, you will have an unlimited lifetime access to the course, which means you can pace yourself at a rate that is convenient for you to complete the material. A chapter generally starts with the theory and follows with a quiz and exercises. We also include some additional videos from time to time.

How much is the course?

The Investing 101 course costs $99. If you are interested, do not hesitate to send a message and ask us if we have any specials!

When can I start and how long will it last?

The course starts as soon as you register! Having Investing 101 by your side is like having a book in your shelf. In other words, you will have an unlimited lifetime access to it, where you can always come back and review a specific theory or exercise if needed.

Invest2Success is a professional investment education, training and stock option company. They delve into the futures Forex commodities market systems that provide investors/traders with the tools they need to become a successful investor, speculator and trader. Invest2Success offers free investing information of valuable articles plus software trials which help empower leading professionals by investing in education training programs. Also valuable are online stocks/bonds options Forex and commodities trading platforms. Instead of working hard for your money, visit us to learn and turn it around by having your energy and money work for you.

Begin by planning and fine tuning your financial plan frequently. We will determine our successes in our business and personal lives by the limitations we put on ourselves. Time flies, so make your 24 hours count. To work towards your financial freedom you need to decide on your investment goals and then take action to educate yourself with the right investing knowledge.

Begin your investment journey immediately. Surf the site for things of interest and that you can utilize on investing and trading for your financial freedom. Once you’ve chosen to educate yourself, set your investment goals and implemented your plan of action then your time and money freedom success will be yours.

The Motley Fool header with sloganIn 1993, brothers David and Tom Gardner founded The Motley Fool as a multimedia financial services company fully committed to building the world’s greatest investment community.

At first they started as authors and columnists in major newspaper, but quickly got online at Fool.com.

Via their website, The Motley Fool reaches millions of people every month. Other forms of contact are through books, newspaper columns, television appearances and subscription newsletter services. They support shareholder values and works continuously for you, the individual investor.

The Motley Fool supports financial solutions for all investors. The products and services, either free or for a fee, online or offline; they are constructed to allow you to take care your financial lives. Check our reviews of their most popular paid services:

Fool.com: If analyzing the latest and greatest earnings reports or even helping investors locate the next major stock, this website does publish hundreds of articles every week. Fool.com gives you news, analysis and commentary through partnerships with Yahoo!, MSN, AOL and many others.