US federal legislation of 1890 that prohibited the creation of monopolies by outlawing direct or indirect attempts to interfere with the free and competitive nature of the production and distribution of goods. Amended by the Clayton Act of 1914. Also called Sherman Act.
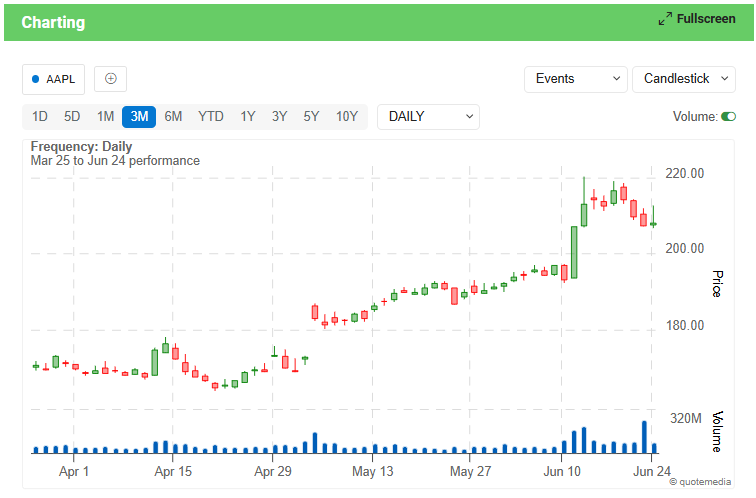
Many experienced investors forgot a popular stock market adage to “NEVER CATCH A FALLING KNIFE” when they picked Apple stock (AAPL) at $500 a share. This seemed like a very attractive price as the stock had already fallen 30% over the prior three months. What is a young investor to learn about how to pick the right stock from Apple dropping an additional 10% today?
What is a “falling knife?”
A security is considered a “falling knife” when it’s price has been trending down for a period of time. These securities may rebound, but most savvy investors stay away as it is impossible for novice investors to pick the stock’s bottom. As the phrase suggests, buying into a market or a stock with a lot of downward momentum is quite dangerous. If you are one of the lucky few that time their purchase perfectly, a buy at the bottom of a long downtrend can be quite rewarding – but the risks outweigh the rewards.
As an investor analyzes a stock like Apple, which recently lost a significant portion of its worth, they may feel an overwhelming temptation to invest. The reasoning may be that “If it was worth $700 just three months ago, then isn’t it a better value at $500 today?” The reason it may not be a better value today is that institutions with big money who buy big blocks of stock may have the inside scoop. They get more access to insider type information and know better than the common investor about the financial condition of a company. They also get economic and market intelligence that few are privy to. You must realize that it is this big money that moves stock prices, not the little investors buying 50 to 100 shares at a time.
When the news finally drops about the internal issues for Apple, as it did on its January 23rd 2013 quarterly earnings release, many investors run for the doors (sells their holdings) which adds to the stock’s supply and forces more erosion of the stock’s price. At this new lower price, the institutions may or may not determine that the stock has reached a value that their intelligence has specified is a new buying opportunity for the stock. So, it is best to sit back and wait for the real bottom to form and watch for the next uptrend.
The lesson for all buyers is that unless you have the real inside information, do not buck a stock’s trending price and never buy a stock that is falling. Catching a falling knife is an adage that we all too often forget. It is a confirmation of the other adage that “the trend is your friend.”
Definition: An order to buy or sell a stock at a fixed price. This order is active until 1) the trade is executed, 2) the investor decides to cancel it or 3) a specified time period elapses.
Explanation: Typically, GTC orders are canceled by brokerage firms after a specified time period like 30-90 days. Investors use this type of order typically to buy a stock at a lower price or sell a stock at a higher price. For example if an investor owned a stock that is currently $40 and the investor wants to sell it if it reaches $50, you can use a GTC order. Once the GTC order to sell is placed, if the price of the stock reaches $50 at any point over the next few months your shares will be sold.
Investor periodicals supply countless explanations why stock prices fluctuate as they do. You will hear about the influences on stock prices like earnings or the economy or the credit markets. While these factors impact buyers and sellers of stocks, in reality they have minimal direct impact on prices. These and many other factors do is change the balance of supply and demand.
Stock prices are a direct result of supply and demand. All the other influences like debt, balance sheets, earnings and so on affect the desirability of owning (or selling) a stock. If a company surprises stock owners with low earnings, demand for the stock may wither. As it does, the equilibrium between buyers and sellers of the stock is changed.
Future buyers will require a discount in the stock’s price and many sellers will be motivated to accommodate. More sellers than buyers means that supply will exceed demand, so the price falls.
Prices Drop
At some point, a stock’s price will drop enough that buyers will find it attractive. There are many factors that can changes this dynamic. As buyers move into the market for a stock, demand grows faster than supply and so the price will increase.
Often supply and demand find equilibrium at a price that buyers accept and sellers accommodate. When supply and demand balance, so they are roughly equal, prices will gyrate up and down in a narrow price range. We can find many examples of stocks staying in a flat range for days or months before an event disrupts the supply/demand balance.
If demand for a stock exceeds the supply, its price will rise. However, it will only rise to the point where buyers find the price attractive. After which, demand will typically wane. As you know, declining demand will cause stock owners to sell. As owners sell (for any reason), the price will fall as there is now more supply than demand. By dropping the price, sellers of the stock hope to encourage someone to buy it. The dynamic works just the same when demand increases but in reverse. As the price falls, it will reach a level where buyers find the stock attractive and demand will increase. When investors start buying, the stock’s price will rise as more and more sellers need to be enticed to sell their shares.
This mechanics of supply and demand is the most important truth that new investors need to learn about stock prices. It is the the give and take between supply and demand that sets the price.
Who can Impact the Supply Demand Equilibrium
Only Institutions like Mutual Funds, Pension Funds and Banks trade in sufficient volume to impact stock prices. These large transactions drive prices up or down depending on the number and speed with which they buy or sell stocks. Stocks are subject to the law of supply and demand as much as any other product. Identifying stocks with the proper technical indicators to motivate institutional buying or selling is critical in locating stocks that are ready to make large price moves.
“It takes big demand to move price up, and the largest source of demand for stocks is by far the institutional buyer.” — William J. O’Neil
Decreasing the long-run average and marginal costs that come from an increase in the size of a factory or plant. Economies of scale can be from the inner workings of an organization. This could include the lower cost from adding technology and better organization.
Details on Economies of Scale
In simpler terms economies of scale is a decrease in your costs thanks to being bigger.
Take, for example, two car manufacturers. The first has a very small shop, with five employees. He only sells five cars a year so he can only invest 1,000$ each year to hire employees, robots and other ways of building his cars faster. The employees will have to be able to do a lot of different things. They also won’t be able to buy robotics. Another big problem is that they won’t have enough room to work on cars all at the same time, they may get in each others way or have to wait for the person before him to finish.
On the other hand, the second car producer sell thousands of cars and can invest millions each year. Unlike the small car producer he can have specialized workers do a task one after the other and very quickly. He can also buy specialized robots that can do the job much faster than any human. He can do this because his scale or size is bigger, he cant afford to invest in bigger and better machines because he already makes so much money producing lots of cars.
One of the greatest examples of economies of scale is Ford F, he was a pioneer in this and was able to achieve great success by having people do one thing really well.
Bigger is not always better
There is a point in economies of scale, however, where things will actually get less efficient and more expensive. An example of this is hiring so many workers that they just step over each other, or have too little to do. That’s why companies strive to keep themselves in a happy middle and have the lowest costs possible.
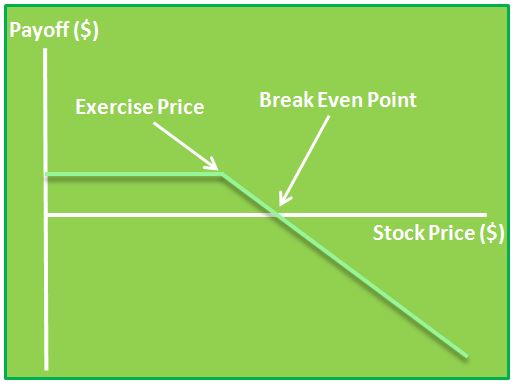
An uncovered call is a short call option position where the writer does not own the specified number of shares specified by the option nor has deposited cash equal to the exercise value of the call. These type of options are also called naked call and are the opposite of covered calls. This option strategy is one of the riskiest option strategies you can take as there is unlimited risk.
Explanation of an Uncovered Call:
An uncovered call is most commonly created by writing a call option without owning the underlying stock.
Covered calls, where the writer of the option also owns the stock and thus protects himself from large rises in the stock’s price are protected from large losses. Using uncovered calls, on the other hand can have limitless losses as the price of the stock rises.
Here is the option payoff diagram associated with this strategy:
As you can see above, as the stock price increases (towards the right) the loss can keep going indefinitely.
An alternative retirement plan to a 401(k) plan offered by non-profit organizations such as universities and charitable organizations, rather than corporations. There are advantages to 403(b) plans: contributions lower taxable income, larger contributions can be made to the account, earnings can grow tax-deferred, and some plans allow loans. Contributions grow tax-deferred until withdrawal. Withdrawals are taxed as ordinary income (which is sometimes a disadvantage).
Details on 403(b):
All information for these forms are issued from the IRS which you can view on their website. Tax shelters are a very important way to try and increase income and everyone should take a look at ways of investing (legally) in the most efficient tax ways possible.
When a company offers to trade one security in return for another security. The most common use of an exchange offer is when a company offers to give shares of a certain held company if the shareholders will return shares of another held company. Exchange offers can use any type of securities, such as bonds.
Stock market prices are affected by business fundamentals, company and world events, human psychology, and much more.
Stock trading is driven by psychology just as much as it is by business fundamentals, believe it or not. Fear and greed are the two of the strongest human emotions that affect the market. For example, it is easy to get caught in the trap of selling a stock prematurely because it dipped temporarily and fear set in. On the other hand, it is also easy to miss out on a respectable gain because greed was telling you to hold out for more, and then the stock drops back down.
One of the main business factors in determining a stock’s price is a company’s earnings, including the current earnings and estimated future earnings. News from the company and other national and world events also plays a large role in the direction of the stock market. Some examples of this are oil prices, inflation, and terrorist attacks.
Every analyst and trader has a different perception of what that stock price should be now and where it might be in the future, and trading decisions are made accordingly.
Bad News or “Good” Bad News?
Layoffs
This is usually good for the company and its stock price because expenses will be reduced significantly and quickly. This should help increase earnings right away. It is not always a major warning sign; it could just be a reaction to a slower economy. It is one of the quickest ways a company can cut expenses if sales have not been meeting expectations.
Store Closings
This event often causes the stock price to go up for the same reasons as layoffs. However, this is not always the case. Closing stores actually requires a lot of money, and the positive effects of it do not take place immediately. This could be a sign that the company is truly in trouble at the moment. They probably have lower sales and higher expenses than they want, possibly due to a slowdown in the industry or the overall economy. The good news is that their management is being pro-active about maintaining profitability. Unfortunately, the stock price may go down for the next few months.
Firing of CEO or Company Official(s)
This may sound very negative at first, but it does show that the company’s board of directors was bold enough to take drastic actions to help the company in the long run. The stock price could go up or down after this announcement, depending on the situation. In some cases this event could be a sign of corruption that reaches beyond these individuals and there could be more negative announcements to come.
Market Scandals
Traders tend to frown upon corruption in the stock market. Mutual fund scandals that have occurred in the past few years and corporate corruption such as Enron are two such examples. If people cannot trust the stock market, why would they invest their hard-earned money in it? In these situations it is harder for the market to go up because there is a lower demand for stocks.
Analyst Recommendations
Many traders rely on experts’ opinions about companies and future stock prices. Are they always correct? Of course not. Nobody can predict what will happen in the future. They can, however, make educated guesses based on past performances and future prospects for the companies and industries they follow.
Round Numbers
Traders often like nice round numbers for their perceived stock price, such as $10.00 or $35.00. It is common for prices to settle near these round numbers, at least briefly. Also, many traders place automatic buy or sell orders right near these round numbers, causing the stock price to become slightly erratic when it first reaches that target.
Technical Analysis
One of the most popular methods for helping predict a stock’s price, at least in the short term, is called Technical Analysis. This method involves looking for patterns or indicators in stock prices, volumes, moving averages, and many others, over time. Obviously nobody can predict the future but this method can be effective in many cases because human beings are somewhat predictable. For example, when people see a stock start falling dramatically they often panic and sell their positions without investigating what caused the fall. This causes even more people to sell their shares and this often leads to an “overshoot” of the stock price. If you believe the price went too far down you can try to buy it at the bottom and hope that it will come back up to a more reasonable level.
Another common example involves Moving Averages. Many traders like to chart the 50-day and 200-day Moving Averages of their stock prices along with the prices themselves. When they see the current price cross over one of these Moving Averages on the charts it can be an indicator of a change in a long-term trend and it may be time to buy (or sell) the stock.
Click Here to see all Beginner Stock Trading Articles
Expected vs Realized Earnings
The realized and expected earnings of a company have a significant impact on the movement of its stock price. Realized earnings refer to a company’s actual earnings for a given period, while expected earnings are what investors predict the company will earn in the future. When a company’s realized earnings exceed expectations, it is often a positive sign for investors and leads to an increase in the stock price.
On the other hand, when realized earnings fall below expectations, stock prices tend to decrease as investors believe the company’s future prospects may be challenging. Overall, realized and expected earnings play a critical role in determining investors’ perception of a company’s financial performance and can significantly influence the movement of its stock price.
Earnings reports are made available to the public to announce a company’s most recent historical performance. Quarterly reports feature the previous three months, while annual reports provide a snapshot of the most recent year. These reports feature commentary from the company about initiatives and projections moving forward.
The EPS, or earnings per share, is one of the most crucial metrics that can impact stock price movements in the short and long run. During quarterly earnings announcements, analysts create a consensus estimate for a company’s EPS, representing the sum of its net profit dividedby the total number of outstanding shares. A company’s actual EPS is then compared to the estimate. If the actual EPS is higher than the estimate, stock prices are likely to rise as investors become more optimistic about the company’s future prospects. In contrast, if the company’s actual EPS falls short of the estimate, stock prices typically fall.
Investors use other metrics and ratios within the earnings report, such as revenue, margins, and P/E ratios, that can further influence stock price movements. Overall, understanding how EPS and other financial metrics can influence stock price movements is essential for investors looking to make sound decisions in the stock market.
Systematic vs Unsystematic Risk
Finally, stock price fluctuations deal with the concept of risk. There are two types of risk, systematic and unsystematic. Systematic risk is an event that can affect the stock market as a whole. Unsystematic risk is specific to the company or industry. Beta is the measure of the volatility a stock has in comparison to the market as a whole. A beta greater than 1 represents a stock that will move higher than the market in periods of growth but decrease more in periods of decline.
Systematic Risk
Systematic risk includes events such as wars, interest rate fluctuations, recession, and geopolitical occurrences. These events tend to affect all stocks regardless of company specific performance and growth prospects. Systematic events are seen as disruptions to the market and generally cause a downward shift in stock prices.
Unsystematic Risk
Unsystematic risk includes company or industry specific events. For example, companies that produced radios were at risk when TVs became popular, or companies that grow and sell vegetables are affected by droughts or hurricanes that destroy their crops. These risks can greatly affect a stock, and often cause sharp declines in price.
Reading candlestick charts is an effective way to study the emotions of other traders and to interpret price. Candles provide a trader with a picture of human emotions who are used to making buy and sell decisions.
On a piece of paper, write down the following statement with a big black marker:
There is nothing on a chart that matters more than price. Everything else is secondary. *Please note that this author implies volume from the range of price on any given day so it is as easy to say that nothing is more important than volume. I like to point out that traders should consider price and volume. Volume to identify interest level of institutional buyers and price to identify the direction of the market.
Take that piece of paper and tape it to the top of your monitor! I think too often swing traders get caught up in so many other forms of technical analysis that they miss the most important thing on a chart.
You do not need anything else on a stock chart but the candles themselves to be a successful swing trader! And, there is nothing that can improve your trading more than learning the art of reading candlestick charts. Believe it.
Who are the buyers and sellers?
There are only two groups of people in the stock market. There are buyers and sellers. We want to find out which group is in control of the price action now. We use candles to figure that out.
The picture above shows how candlesticks are constructed. The highs and lows of the time period are called the wicks and the open and close form the body. The candle itself is the range. When stocks close at the bottom of the range we conclude that the sellers are in control. When stocks close at the top of the range we conclude that buyers are in control.
Note: In the stock market, for every buyer there has to be a seller and for every seller there has to be a buyer.
If a stock closes at the top of the range, this means that buyers were more aggressive and were willing to get in at any price. The sellers were only willing to sell at higher prices. This causes the stock to move up.
If a stock closes at the bottom of the range, this means that sellers were more aggressive and were willing to get out at any price. The buyers were only willing to buy at lower prices. This causes the stock to move down.
Where a stock closes in relation to the range tells us who is winning the war between buyers and sellers. This is the most important thing to know when reading candlestick charts.
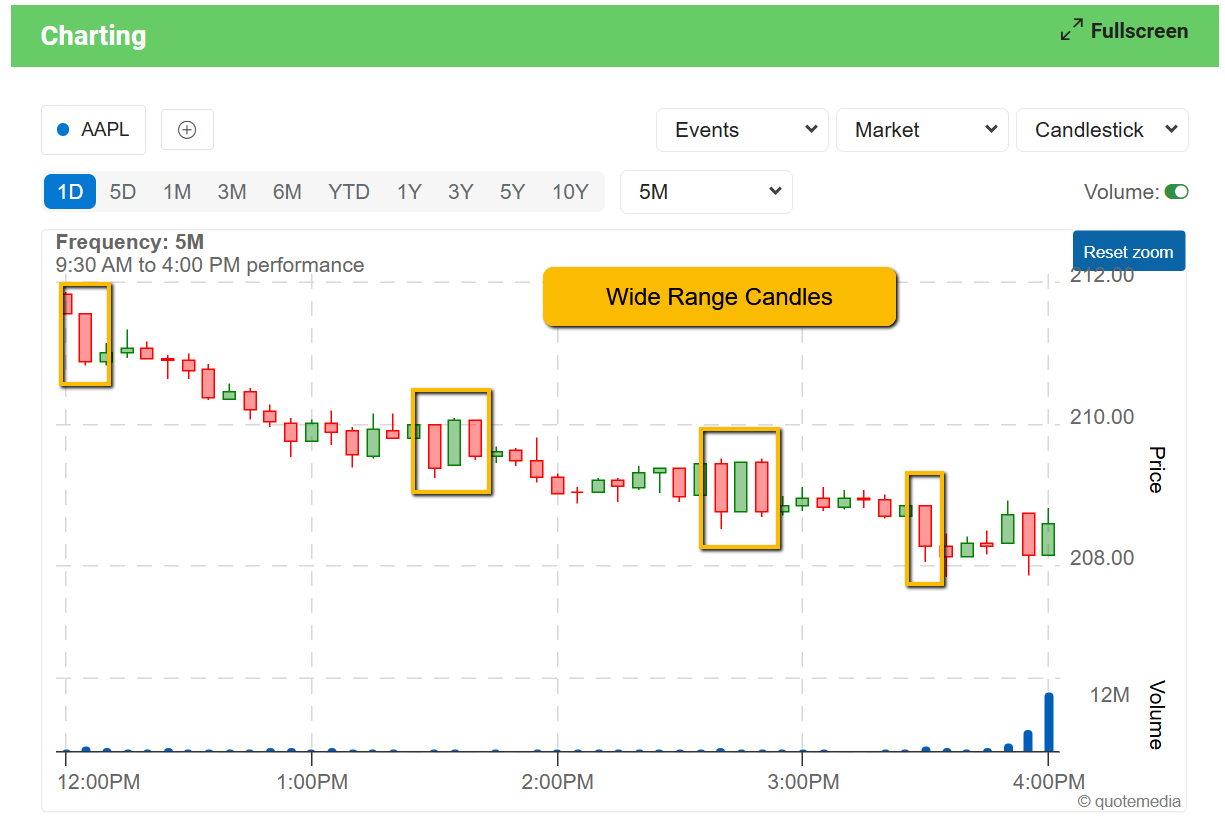
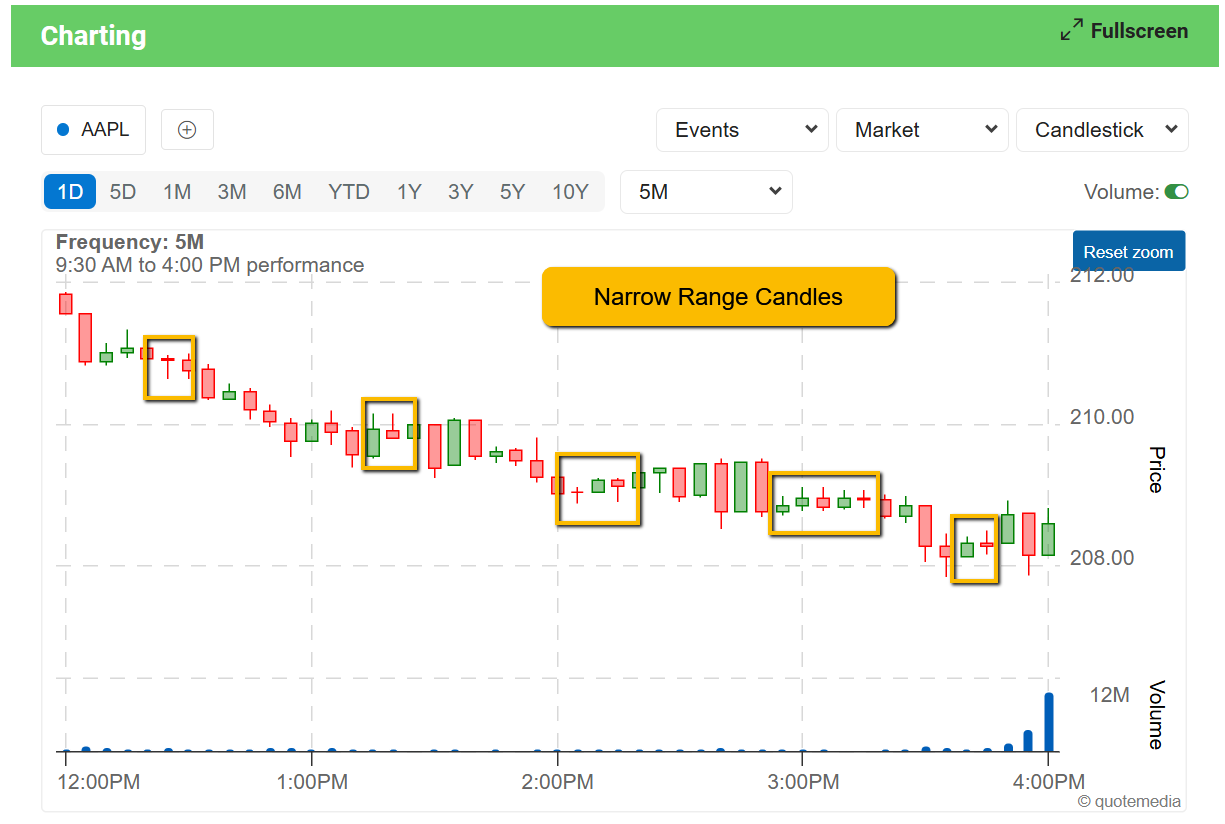
We can classify candles in two categories: wide range candles (WRC) and narrow range candles (NRC). Wide range candles state that there is high volatility (interest in the stock) and narrow range candles state that there is low volatility (little interest in the stock).
The chart below shows how stocks move in relation to the range and closing prices. You’ll notice that stocks tend to move in the direction of wide range candles. This is important!
Wide Range Candles (WRC)
If we know that stocks tend to move in the direction of wide range candles, we can look to the left of any chart to gauge the interest of either the buyers or sellers and trade in the direction of the trend and the candles.
The importance of this cannot be overstated! You want to know if there is interest in the stock and if it is being accumulated or distributed by institutional traders.
Narrow Range Candles
Narrow range candles imply low volatility. This is a period of time when there is very little interest in the stock. Looking at the chart below you can see that these narrow range candles often lead to reversals (up or down) because low volatility leads to high volatility and high volatility leads to low volatility.
So, knowing this, doesn’t it make sense to enter a stock in periods of low volatility and exit a stock in periods of high volatility? Yes.
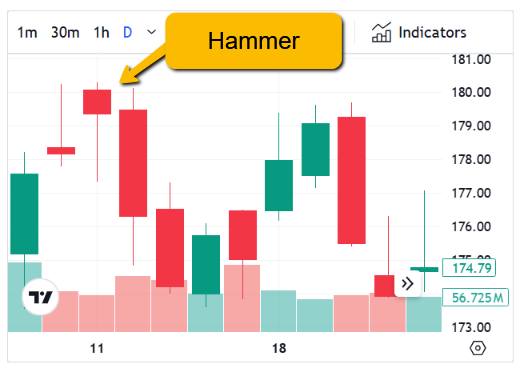
What about hammers, doji’s and shooting stars?
I know what you’re thinking. You thought this page was going to be about hammers, doji’s, and shooting stars. Sorry to disappoint you, but knowing all of the different types of candlestick patterns is really not at all necessary once you understand why a candle represents the struggle between buyers and sellers.
Consider this…
In the picture, we see a classic candlestick pattern called a hammer. What happened to cause this? The stock opened, then at some point the sellers took control of the stock and pushed it lower. Many traders were shorting this stock thinking it was headed lower.
But by the end of the day, the buyers took control, forced those short sellers to cover their positions, and the stock had enough strength to close the stock at the top of the range. So, this is obviously very bullish!
When we are reading candlestick charts, why would we need to know the name of the pattern? What we do need to know is why the candle looks the way that it does rather than spending our time memorizing candlestick patterns!
Before the advent of computers and data feeds, the use of charts to formulate trading strategies was outside the mainstream of trading techniques. The reason, creating charts was difficult. Each chart had to be created by hand, with chartists adding another data point at the close of trading for each security they were following. Also, chart users were often misrepresented as a bizarre group of individuals huddled in the recesses of the brokerage house as they added the latest data point to their closely coveted charts.
But with the advancement of technology and the increased popularity of technical analysis, the use of charts has greatly increased, making them one of, if not the most important tools used by technical traders.
A single chart has the ability to display a significant amount of information. More conceptually, charts are an illustration of the struggle between buyers and sellers. While this point is debatable between the schools of investment like technical, fundamental and efficient market analysis, technical analysis assumes that: a) prices discount everything, b) prices moves in trends and c) history repeats itself.
Assuming the above tenets are true, charts can be used to formulate trading signals and can even be the only tool a trader utilizes.
Patterns on a Chart Chart patterns signal to traders that the price of a security is likely to move in one direction or another when the pattern is complete.There are two types of patterns in this area of technical analysis: reversal and continuation. A reversal pattern signals that a prior trend will reverse on completion of the pattern. Conversely, a continuation pattern indicates that the prior trend will continue onward upon the pattern’s completion.The difficulty in identifying chart patterns and their subsequent signals is that chart use is not an exact science. In fact, it’s often viewed as more of an art than a science. While there is a general idea and components to every chart pattern, the price movement does not necessarily correspond to the pattern suggested by the chart. This should not discourage potential users of charts – once the basics of charting are understood, the quality of chart patterns can be enhanced by looking at volume and secondary indicators.There are several concepts that need to be understood before reading about specific chart patterns. The first is a trendline, which is a line drawn on a chart to signal a level of support or resistance for the price of the security. Support trendlines are the levels at which prices have difficulty falling below. Conversely, a resistance trendline illustrates the level at which prices have a hard time going above. These trendlines can be constant price levels, such as $50, or rise or fall in the direction of the trend as time goes on.Now that we have an understanding of the concepts behind the use of charts as a trading technique, we can start to explore the many different patterns used by chartists.
Click Here to see all Beginner Stock Trading Articles
Average buyers of stocks are a drop in the bucket in terms of how they impact daily stock transactions (volume) compared to institutional buyers. The institutional buyers only buy in large blocks. When institutional buyers get into the market, they cause significant increase in demand. Like any case of supply and demand, when demand increases and supply stays the same, price will increase. When a stock becomes desirable, it is more likely that supply may decrease (as current stockholders will be less willing to sell) which will cause even more price pressure. The more one institutional buyer impacts price and volume, the more other institutional buyers will get interested in the stock and be motivated to buy the stock as well.
It stands to reason then that the greater volume should take place in the same direction as the prevailing trend
Now lets look at how volume can cause stock prices to fall. If institutional buyers start dumping a stock, the supply will radically increase. Typically, demand will decrease at the same time as other institutions will either 1) concur that the company’s value has declined or 2) be motivated by the others selling the stock. As we know, when sellers outnumber buyers the stock price will fall.
In a downtrend, the volume should be heavier during down moves and lighter on bounces. As long as that pattern continues, the selling pressure is greater than buying pressure and the downtrend should continue. It’s only when that pattern begins to change that the chartist starts looking for signs of a bottom.
Price is a Function of Herd Mentality
Based on this volume precedes price analysis, it is probably obvious that there is a herd mentality when it comes to the market. When one institution is buying a large block of stock in a company, other institutions will spot the buying and be motivated to jump in as well. This increases the pressure on the stock price. You and I are small investors so it is important to join the herd and let the supply and demand caused by the institutions carry our investments higher. Standing on our own and ignoring the direction of the market and of of a stock is typically a bad idea. It may sound like a good idea to buy a stock when it develops a new low but what will stop the stock from continuing to fall. It is typically the market pressures of institutional buyers that will carry your investments to higher prices.
Support: If the price of a stock falls towards a support level it is a test for the stock: the support will either be reconfirmed or wiped out. It will be reconfirmed if a lot of buyers move into the stock, causing it to rise and move away from the support level. It will be wiped out if buyers will not enter the stock and the stock falls below the support.
Resistance: A chart point or range that caps an increase in the level of a stock or index over a period of time. An area of resistance or resistance level indicates that the stock or index is finding it difficult to break through it, and may head lower in the near term. The more times that the stock or index has tried unsuccessfully to break through the resistance level, the more formidable that area of resistance becomes.
Resistance and support levels are widely used by experienced traders to formulate trading strategies. For example, if a stock is approaching a very strong resistance level, a trader may prefer to close the position rather than take the risk of a significant decline if the stock uptrend reverses.
On an interesting note, resistance levels can often turn into support areas once they have been breached. In a strong uptrend, investors and traders will embark on a buying spree once a stock conclusively breaks through resistance, sending it sharply higher. But traders and investors who missed the move may wait on the sidelines for a better price. This pent-up demand can become a source of support for the stock as it approaches the earlier resistance level.
Click Here to see all Intermediate Stock Trading Articles
MetaStock is specifically designed for traders who do their analysis after the markets close (If you are interested in real-time trading, check out MetaStock Pro). Whether you’re an experienced, active trader or just learning how to trade the markets, MetaStock helps you succeed. It contains powerful analysis tools so you can make informed decisions about what to buy and sell, and when to execute… resulting in the most profitable trades.
MetaStock comes with many out-of-the box trading solutions that are reliable and easy to use. If you want to take your analysis to the next level, MetaStock gives you the ability to customize these solutions to your particular trading style.
Whether you trade stocks, options, mutual funds, futures, commodities, FOREX, bonds or indices, MetaStock has the tools you need for superior market analysis and financial success.
Here is what one of our customers has to say about MetaStock:
“MetaStock is obviously made by people who understand traders’ needs. It’s a complete package that’s easy to use, no matter what kind of securities you trade. It’s the single tool that’s allowed me to fine-tune my trading approach, pursue my avocation and build a satisfying retirement.”
Discover the flexabliity of the Power Console
Successful trading decisions require the right mix of content and capability. The Power Console takes everything that is great about MetaStock and puts it in one convenient location. You’ll notice the difference the first time you open MetaStock 12. The Power Console is front and center. Now you can open a chart, start a scan, run a test, review reports, make custom lists, and more… from one full-featured dashboard.
“Where do I start in a universe of instruments?”
There are thousands of instruments out there. Moreover there are hundreds of systems you might want to use to trade them. How do you even begin to sort through the possibilities? How do you find the winners? Enter theMetaStock Explorer. The Explorer lets you use YOUR criteria to scan the markets and find the instruments that fit YOUR strategy.
“How do I interpret the indicators on my chart?”
Imagine having the input of industry professionals when and where you need it. That’s what the MetaStock Expert Advisor is all about. You can display the industry’s most popular indicators with correlating buy and sell signals. Expert commentary gives you specific information about the indicators and what triggered the signal. It’s a great educational tool.
“How can I test and optimize my strategies?”
Do you want to create, back-test, compare, and optimize your strategies BEFORE you risk money in the market. With the MetaStock System Testeryou can. You can even test multiple instruments against multiple systems. By analyzing every trade that would have occurred historically, you build confidence in your system… something all traders need.
MetaStock Pro is specifically designed for real-time traders—traders who use intra-day data to transact in real-time throughout the trading day. Whether you’re an experienced, active trader or just learning how to trade the markets, MetaStock helps you succeed.
The software contains powerful analysis tools to help you make informed decisions about what to buy & sell and when to execute to make the most money possible. MetaStock comes with many out-of-the box trading solutions that are reliable and easy to use. And if you want to take your analysis to the next level, MetaStock gives you the ability to customize these solutions to your particular trading style.
MetaStock is powered by the incredible MetaStock XENITH Real-Time Data and News package. More than a simple data feed, MetaStock XENITH fuses the information, tools and analytics you need into a single desktop customized to the way you work. You can use the many pre-defined screens, like the “equity trader” screen, or easily customize your desktop to view the content you use most often.
Whether you trade stocks, bonds, mutual funds, futures, commodities, FOREX, or indices, MetaStock has the tools you need for superior market analysis and financial success. In fact, 84% of our customers report that they have been successful using the MetaStock software! Here is what one of our customers has to say about MetaStock:
“MetaStock is obviously made by people who understand traders’ needs. It’s a complete package that’s easy to use, no matter what kind of securities you trade. It’s the single tool that’s allowed me to fine-tune my trading approach, pursue my avocation and build a satisfying retirement.”
Discover the flexabliity of the Power Console
Successful trading decisions require the right mix of content and capability. The Power Console takes everything that is great about MetaStock and puts it in one convenient location. You’ll notice the difference the first time you open MetaStock 12. The Power Console is front and center. Now you can open a chart, start a scan, run a test, review reports, make custom lists, and more… from one full-featured dashboard.
“Where do I start in a universe of instruments?”
There are thousands of instruments out there. Moreover there are hundreds of systems you might want to use to trade them. How do you even begin to sort through the possibilities? How do you find the winners? Enter theMetaStock Explorer. The Explorer lets you use YOUR criteria to scan the markets and find the instruments that fit YOUR strategy.
“How do I interpret the indicators on my chart?”
Imagine having the input of industry professionals when and where you need it. That’s what the MetaStock Expert Advisor is all about. You can display the industry’s most popular indicators with correlating buy and sell signals. Expert commentary gives you specific information about the indicators and what triggered the signal. It’s a great educational tool.
“How can I test and optimize my strategies?”
Do you want to create, back-test, compare, and optimize your strategies BEFORE you risk money in the market. With the MetaStock System Testeryou can. You can even test multiple instruments against multiple systems. By analyzing every trade that would have occurred historically, you build confidence in your system… something all traders need.
StockCharts.com has made great looking financial charts made easy. We have the tools, educational information, expert opinions, and support you need to make more money in the market. Just remember that while anyone can use our free tools, only subscribers have access to our most powerful features
A Word from the President
Financial charts can help you make some extremely profitable investing decisions. They can also lead you astray quite easily. In 1999, I founded StockCharts.com to help online investors obtain and use financial information more effectively. Since then we’ve constantly improved our site and our service. Our Web site gives you access to some of the most powerful tools for technical analysis available anywhere AND we give you common sense advice and examples of how to use them effectively.
You can sample most of our charting services free of charge by clicking on the “Free Charts” tab above. Our interactive charts give you the same analytical power found in software packages costing $500 or more. Newsletter subscribers typically pay $100+ per year for the advice and commentary we provide free of charge. And don’t forget the data. (It’s criminal how much that stuff costs!) Real-time market info can cost you another $500+ per year. So, just by visiting our Web site, you are already way ahead of the game.
In October of 2002, we were thrilled when author John Murphy, probably the most recognized name in the field of technical analysis, joined our team. The integration of John’s market commentary and technical expertise with our charting tools gives our users access to the best online financial analysis on the Web.
In 2003, we launched our on-line Technical Analysis bookstore with the aim of helping our users learn even more about investing with charts. Each month, we put at least one book on sale for the lowest price anywhere – even if it means selling that book at a loss. Because of that policy, our monthly bookstore specials and bundles are extremely popular.
Too good to be true? We don’t think so. Here’s a page with some of the compliments and awards we’ve received through the years. If you ever have feedback for us (good or bad), feel free to drop us a line using our online support form (for fastest service) or contact me personally at chipa@stockcharts.com (but I may not get back to you as fast). Here’s the rest of our contact information:
NYSE.com is the official web site for the NYSE. NYSE Euronext (NYX), a leading global operator of financial markets and a provider of innovative trading technologies, is the only exchange operator in the Fortune 500. With exchanges in the US and Europe, NYSE Euronext equities marketplaces represent one-third of equities trading worldwide. NYSE Euronext is also one of the world’s leading futures and options trading venues, with four markets based in the US and Europe offering derivatives on commodities, FX, equities, bonds, interest rates, indices and swaps. Its commercial technology division, NYSE Technologies provides best-in-class transaction, data, and infrastructure management services and solutions.
MarketWatch operates a financial information website that provides business news, analysis and stock market data. It offers personal finance news and advice, tools for investors and access to industry research. Along with its flagship website, the company operates BigCharts.com and the stock market simulation site VirtualStockExchange.com.MarketWatch produces the syndicated MarketWatch Weekend television program and provides radio updates every 30 minutes on the MarketWatch.com Radio Network. It also offers subscription products for individual investors, including the Hulbert Financial Digest suite of products, Retirement Weekly and ETF Trader.
An indicator used in technical analysis as an objective value for the strength of trend. ADX is non-directional so it will quantify a trend’s strength regardless of whether it is up or down. ADX is usually plotted in a chart window along with two lines known as the DMI (Directional Movement Indicators). ADX is derived from the relationship of the DMI lines.
Analysis of ADX is a method of evaluating trend and can help traders to choose the strongest trends and also how to let profits run when the trend is strong.
Click Here to see all Intermediate Stock Trading Articles

 MetaStock is specifically designed for traders who do their analysis after the markets close (If you are interested in real-time trading, check out MetaStock Pro). Whether you’re an experienced, active trader or just learning how to trade the markets, MetaStock helps you succeed. It contains powerful analysis tools so you can make informed decisions about what to buy and sell, and when to execute… resulting in the most profitable trades.