Definition
A company that provides ideas to support growth and organization as well as introductions for new entrepreneurs to help their startup companies. These startups are usually technology-related.
A company that provides ideas to support growth and organization as well as introductions for new entrepreneurs to help their startup companies. These startups are usually technology-related.
Retained earnings is calculated by adding net income to (or subtracting any net losses from) the beginning retained earnings and then subtracting the dividends that were paid to shareholders:
This equation is also known as the “retention ratio” or “retained surplus”.
Companies retain their earnings to invest in projects or plant improvements that will help the company grow. Examples of these type of investments would be buying machinery or research and development. In general, more mature companies are more likely to have a lower amount of RE compared to dividends whereas younger companies will have far more RE as they try to grow their company and reinvest in their business.
If the net loss for the period is greater than the retained earnings at the beginning of the period, it will be negative, creating a deficit.
A plan offered by a corporation that allows investors to reinvest their cash dividends by purchasing additional shares or fractional shares on the dividend payment date. A DRIP is an excellent way to increase the value of your investment. Most DRIPs allow you to buy shares commission free and at a significant discount to the current share price. Most DRIPS don’t allow reinvestments much lower than $10.
This term is sometimes abbreviated as “DRP”.
If you are looking to open account. We found the best fractional share brokerage is Stockpile. Read this Stockpile Review to find out more.
Have you ever stopped to think about why a unit of stock is called a share? What exactly are you sharing, and who are you sharing it with?
You may recall that stock represents ownership in a company. As an owner, you are entitled to all the rights and responsibilities of a business owner. In a publicly traded company, your responsibilities are limited to the financial commitment you have to the company. This is the amount you paid for your shares of stock. Your worst case scenario is that the company becomes insolvent and your stock becomes worthless. Your liability is said to be limited because no one can come after other assets you may have to cover any obligations of the company.
You also enjoy certain rights. The first is the right to vote for the board of directors. The shareholders, as an entirety, elect a board of directors to hire and direct the executive management team. The company’s executives hire and supervise managers who carry out the plans and direction of the executive management team. The managers, in turn, hire the employees who perform the functional tasks of operations.
The second right shared by the stockholders is a right to their proportionate share of profits. As the company makes money, the board of directors has a choice to make. Do they give the stock holders their share of the profits, or do they keep the profits in the business with the intent of growing and expanding the business, with the expectation that greater profits can be generated in the future?
If profits are kept in the business, on the balance sheet they’re called retained earnings. Profits distributed to stock holders are called dividends.
Some investors prefer dividends. You have heard the expression, “a bird in the hand is worth two in the bush”. Dividends are usually paid in cash and the investor is free to do whatever they wish with their share of the company’s earnings. They can pay their bills, invest in another company, or simply save the cash. Some companies offer investors the opportunity to use their dividends to purchase more shares of stock without having to pay regular trading expenses. These programs are known as DRIPs or Dividend Reinvestment Programs. But regardless of which direction the stock holder takes the tax man commeth.
The dividend tax rate you pay will depend on your income and the amount of dividends you earned. You can learn more about dividend tax rates for 2023-2024 here.
Often it is the tax which motivates investors to shun dividends. Those investors prefer that the company retain its earnings and reinvest in itself. Their hope is that as the company grows in value, so will the price of the stock they own. As the stock value grows, so does the worth of the investor but taxes aren’t an issue until the investor actually sells their stock. If the investor sells the stock for more than they paid for it, the difference is a capital gain. As long as the stock was held for a year or more it is currently taxed at the same rate as dividends. If the stock was held for less than a year, ordinary income tax rates apply.
So the two ways to make money with stocks are Dividends and Capital Gains.
Investors should have a clear understanding of their strategy before purchasing stock so they know the best way to evaluate any potential stock purchase. As you get started with purchasing stocks, keep in mind that having a diversified portfolio is key to the long-term success of your portfolio increasing in value. It won’t do you much good to have made lots of money one month, only to lose it the next, and have no plan for staying on track to achieve your investment goals.
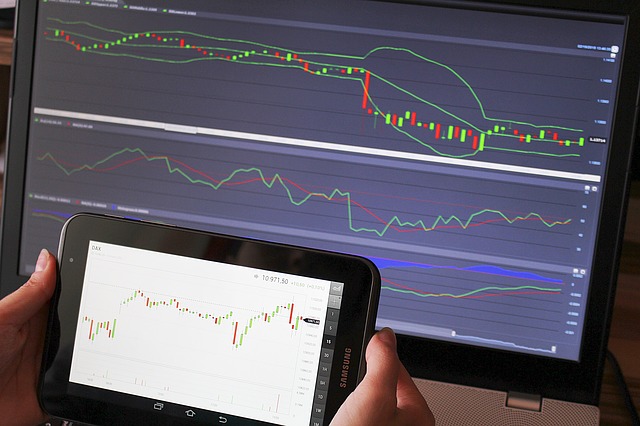
Chart analysis is the same as Technical Analysis.
SIMPLE DEFINITION: Technical Analysis is the use of technical indicator to predict which direction the stock price will move in the future. Technical indicators use past stock prices to calculate their value.
COMPLETE DEFINITION: Technical analysis evolved from analyzing 100s of years of stock data. The theories for technical analysis began in Joseph de la Vega’s accounts of the Dutch markets in the 17th century. In the 1920s and 1930s Richard W. Schabacker wrote books continuing the work of Charles Dow and William Peter Hamilton from their books Stock Market Theory and Practice and Technical Market Analysis. In 1948 Robert D. Edwards and John Magee published Technical Analysis of Stock Trends. This book is considered to be the break through works of the discipline.
The Fed is the US central-banking system which is made up of 12 regional central banks (called the Federal Reserve Banks) which are privately owned banks. The Fed is governed by a seven-member board of governors who are appointed by the president. The Fed is responsible for regulating interest rates and availability of bank credit. It also sets the US banking system’s monetary policies such as legal reserve requirements.
State regulations governing the sale of securities and mutual funds, designed to safeguard investors from being lured into fraudulent or unscrupulous deals. Under this memorandum, only appointed brokers or agents, who are appropriately licensed within the jurisdiction, are allowed to make securities transactions. Blue sky laws are governed by the SEC.
State regulations can vary widely and you should check the applicable laws for the state you wish to trade in, even more so if you wish to be a broker or work in the financial industry.
Definition: An investment service that allows individuals to purchase a stock directly from a company or through a transfer agent. Not all companies offer DSPPs and the plans often have restrictions on when an individual can purchase shares.
Example: The greatest benefit of using direct stock purchase plans for investors is the ability to avoid commissions by not going through brokers. DSPPs often have minimum deposit requirements that range from $100 to $500. They are perfect for investors who have a long-term trading strategy and are looking for an inexpensive way to begin investing.
Since the bottom fell out of the stock market in 2008, investors have been shifting money from stocks into bond funds. Since 2007, there have been $1.39 trillion invested in Bond Funds versus $193 billion in stock funds. The most logical explanation is an attempt to find income and safety, but are bonds truly safe? To explore that question we need to understand where interest rates are now, where they will be in the future, and how changes in the interest rates will affect bonds.
In response the financial crisis, the Federal Reserve (the Fed) lowered the federal funds rate to a historic low of 0% – 0.25% and they have remained there ever since. In their recent guidance, the Fed announced their intention to keep the rate at that low level until the unemployment rate falls below 6.5% which they predict will happen in 2015. The accuracy of their estimation can be argued but it really isn’t they key issue. What is important is that interest rates are as low as they will go and the next change in interest rates will be up. When that happens, bond investors may find their portfolios in trouble.
The rule is simple. When interest rates go up, bond prices go down.
Suppose you buy a $1000 bond today which pays 5% interest. Every year the bond will pay $50 until the bond matures and then you receive the $1000 back. You pay $1000 for the $1000 bond. In investment terms, you just purchased the bond at Par Value.
Tomorrow, the same bond issuer raises the interest rate on new bonds to 6%. Those bonds pay $60 every year until the face amount is returned to the investor. If someone else is looking to buy a bond, they would obviously chose the 6% bond for their $1000 over your 5% bond… unless you were willing to sell your $1000 bond for less than $1000. At some discounted price, the 5% bond is just as attractive as the 6% bond for $1000.
Bond fund buyers need to be aware (or should they beware?). There is no argument that interest rates will be going up. The only unknown is when it will happen. When it does, the prices of the bonds in bond funds will fall and the fund values will go down.
In the world of stock analysis, fundamental and technical analysis are on completely opposite sides of the spectrum.
Earnings, expenses, assets and liabilities are all important characteristics to fundamental analysts, whereas technical analysts could not care less about these numbers and only focus on price and volume. Which strategy works best is always debated, and many volumes of textbooks have been written on both of these methods.
A Technical Analyst would criticize Fundamental analysis as they consider it worthless because company numbers are frequently cooked and they only come out once a quarter. Government statistics usually have a huge lag time, sometimes months after the time period in question. A Technical Analyst would rather look at market information (price and volume) only. This is where true information is as the institutional buyers have a better inside track and will buy/sell in huge volumes based on their inside knowledge. Therefore, a retail investor should buy things that are going up and sell things that are going down.
A fundamental analyst would say that technical analysis ignores all the valuable information about profit, dividends, growth rates and other information that any CEO would use to judge the value of a company.
The bottom line is that you should do some reading for yourself and figure out which system you feel most comfortable with.
 A phrase used for a stock where the price has dropped significantly in a short period of time. A falling knife security can rebound, or it can lose all of its value where the shares become worthless.
Veteran investors will warn: “Don’t try to catch a falling knife”. This happens because investors might see a company they believe in see a very sharp drop in stock price, and expect the stock price to bottom out and start to go back up. However, investors do not know exactly how far a price will fall before it rebounds, so trying to buy a stock with a rapidly falling price is a good way to get cut.
One of the ways to define a corporation. S Corporations are allowed by the IRS for most companies with less than 75 shareholders. This enables the company to enjoy the benefits of incorporation but be taxed as if it were a partnership. This type of corporation is also called a Subchapter S Corporation.
The total amount that the federal government has borrowed including internal debt (borrowed from national creditors) and external debt (borrowed from foreign creditors). National debt is comprised of: (1) Floating debt which is short term borrowings using treasury bills, ways-and-means advances, and money from the central bank. (2) Funded debt, short-term debt converted into long-term debt. (3) Unfunded debt, national savings certificates, savings bonds, premium bonds, and securities from the foreign exchange. National debt has an important role in a country’s finances as government securities are a critical part of the reserves of its financial institutions.
DEFINITION: A Stop Limit is an order that combines the features of stop order with the features of a limit order. A stop limit order executes at a specified price (or better) after a specified stop price is reached. After the stop price is reached, the stop limit order becomes a limit order to buy (or sell) at the limit price or better.
For example, if stock ABC Inc. is trading at $30 and the investor wants to buy stock after it starts to show serious upward momentum (around $35 but not more than $36), the buyer must use a stop limit order to buy with a stop price of $35 and the limit price at $36. If the price of the stock moves above the $35 stop price, the order is activated as a limit order. The stock will be bought as long as it can be filled under $46 (the limit price). If the stock gaps above $46, the order will not be filled.
The total market value of all final goods and services produced in a country in a given year, equal to total consumer, investment and government spending, plus the value of exports, minus the value of imports. The GDP report is released at 8:30 am EST on the last day of each quarter and reflects the previous quarter. Growth in GDP is what matters, and the U.S. GDP growth has historically averaged about 2.5-3% per year but with substantial deviations.
The merger of companies at the same stage of production in the same or different industries. When the products of both companies are similar, it is a merger of competitors. When all producers of a good or service in a market merge, it is the creation of a monopoly. If only a few competitors remain, it is termed an oligopoly. Also called lateral integration. See also vertical integration.
Try these 100% FREE educational and stock trading newsletters to get stock tips emailed to you weekly and start learning How The Market Works!
Click on the offers that interest you, fill in any required information, and then scroll down and click the “Continue” button to start getting some free stock tips!:
 As we plan our investment strategy, we must examine current events. The market has been focusing on current events as the number one driver of market direction. As a result, most large investors are now biting their fingernails waiting for the next shoe to drop. The markets may have to deal with news about the various European national debts, the Iranian nuclear crisis or numerous other concerns.
1) The economy in the U.S. unexpectedly shrank in the fourth quarter, restrained by the biggest plunge in defense spending (22.2 percent decline) in four decades. Government outlays dropped at a 6.6 percent annual pace from October through December, subtracting 1.3 percentage points from GDP.
2) Gross domestic product, the volume of all goods and services produced, dropped at a 0.1 percent annual rate, weaker than any economist forecast in a Bloomberg survey and the worst performance since the second quarter of 2009.
3) Big banks, countries, and cities have been downgraded.
4) Iran nuclear program. This crisis will be next for the world to deal with.
5) North Korean missile program becomes more troubling for the U.S.
6) Spain’s debt problems that could escalate.
7) China, Asia Pacific, and Europe economies still troublesome.
8) U.S. budget- fiscal cliff discussion must be resolved by March. Can Congress and the President get it together or will they take the country down to appease their constituents? Will the markets start to factor in an expected national shutdown in February?
9) States receive 22% of their budget from the federal government. A government shutdown could cause ripples all the way down to the local level.
10) U.S. economic slowdown- stagnate jobs growth.
11) Tax increase in 2013.
12) Can business be inspired to remain in the U.S. and create U.S. jobs or will Government policy continue to expatriate jobs.
13) The next blow to business from the White House.
14) The unemployment rate is serious and could easily turn worse if any negative news were to surface which would compound the problem with the economy.
15) Pending home sales are slumping. December by 4.3% according to National Association of Realtors. That was well below views. What is next?
 16) Our national debt is getting worse and can cause our country’s debt rating to decline again which will cause interest rates on future borrowing to increase. We also know that interest rates will return to normal sooner or later. When this happens, it has been forecasted that debt payments will soar and bring our nation to its knees.
Today, the market may appear oblivious to these pending problems. In fact, a handful of billionaires are dumping American stocks tied to consumer related stocks. Warren Buffet is leading this trend by dumping stock from companies like Johnson & Johnson, Proctor & Gamble and Kraft Foods. Since 70% of the American economy is dependent on consumer spending, it looks like Berkshire Hathaway is betting on a significant American economic slowdown. When will that be realized? Will this shoe drop in February, March or April? If the experts are right, it will have a significant downward impact on the market.
“The trend is your friend” is one of the best known investing sayings, although it’s message is incomplete. The full version should be:
“The trend is your friend, until the end when it bends.”
Often attributed to Marty Zweig (read more)
The trick with buying stocks is to to be patient through the small changes in price until you can identify the point when the trend makes a change in direction or bends.
In this article, we’ll define how to identify a trend and what has to happen for a trend to change. Before we get started, please note that the trend-following methodology should only be applied to stocks with strong fundamental metrics, like strong and improving revenues (sales) and earnings.
You can read more about fundamental analysis to learn how to analyze the fundamentals of business.
A downtrend is a series of lower highs. At each of those points, sellers are deciding that they have had enough and it is time to get out of the stock. When these sellers perhaps urgently accept lower prices to dispose of their stock, the number (supply) of stocks pressures the price lower and helps the trend to continue lower.
When I refer to a “lower high,” I mean that each time the stock attempts to rally and increase in price, it fails to reach the same level as the previous high. Instead, it turns lower. This pattern is evident in the chart, where the price line spikes upward, but not as high as the previous spike, as it falls.
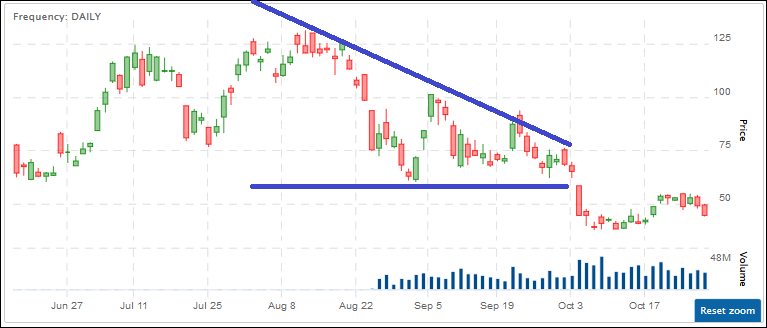
If an investor were to buy this stock during the period shown in the chart, they would be entering a market in a downward trend. Buying a stock in a downtrend is one of the most common ways to lose money. However, a trader who wants to be successful and make a profit will wait for a change in the trend. This change is indicated by a new high price on the chart, signaling a shift from a downward to an upward trend.
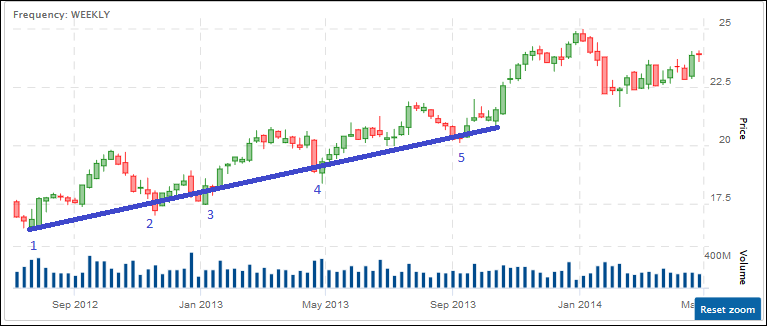
A clear uptrend can be identified by a chart with consistently higher lows. At each higher low, traders recognize the pullback in price as an opportunity to buy more of the stock. As more investors make this decision, the buying pressure increases, driving up demand and, in turn, the stock price. This pattern can be visualized on the chart below as the stock continues to trend upward.
When a stock is stuck in a downtrend, traders can look back and identify the most recent interim high price where the sellers turned the price lower. At this point, I recommend buying the stock only if it breaks above that most recent high price. This signifies that the trend in price may have changed from down to up.
In summary, identifying a change in trend is crucial for investors. By recognizing the most recent high price and looking for a breakout above it, you can potentially enter a new trend. Remember that a trend is a key indicator, and changes in trend can signal potential investing opportunities.