A portfolio is a collection of assets that contribute collectively to an overall return.
There are many different reasons you could create a portfolio, and you need to define your reason or objective from the very beginning before adding stocks and other securities to your account.
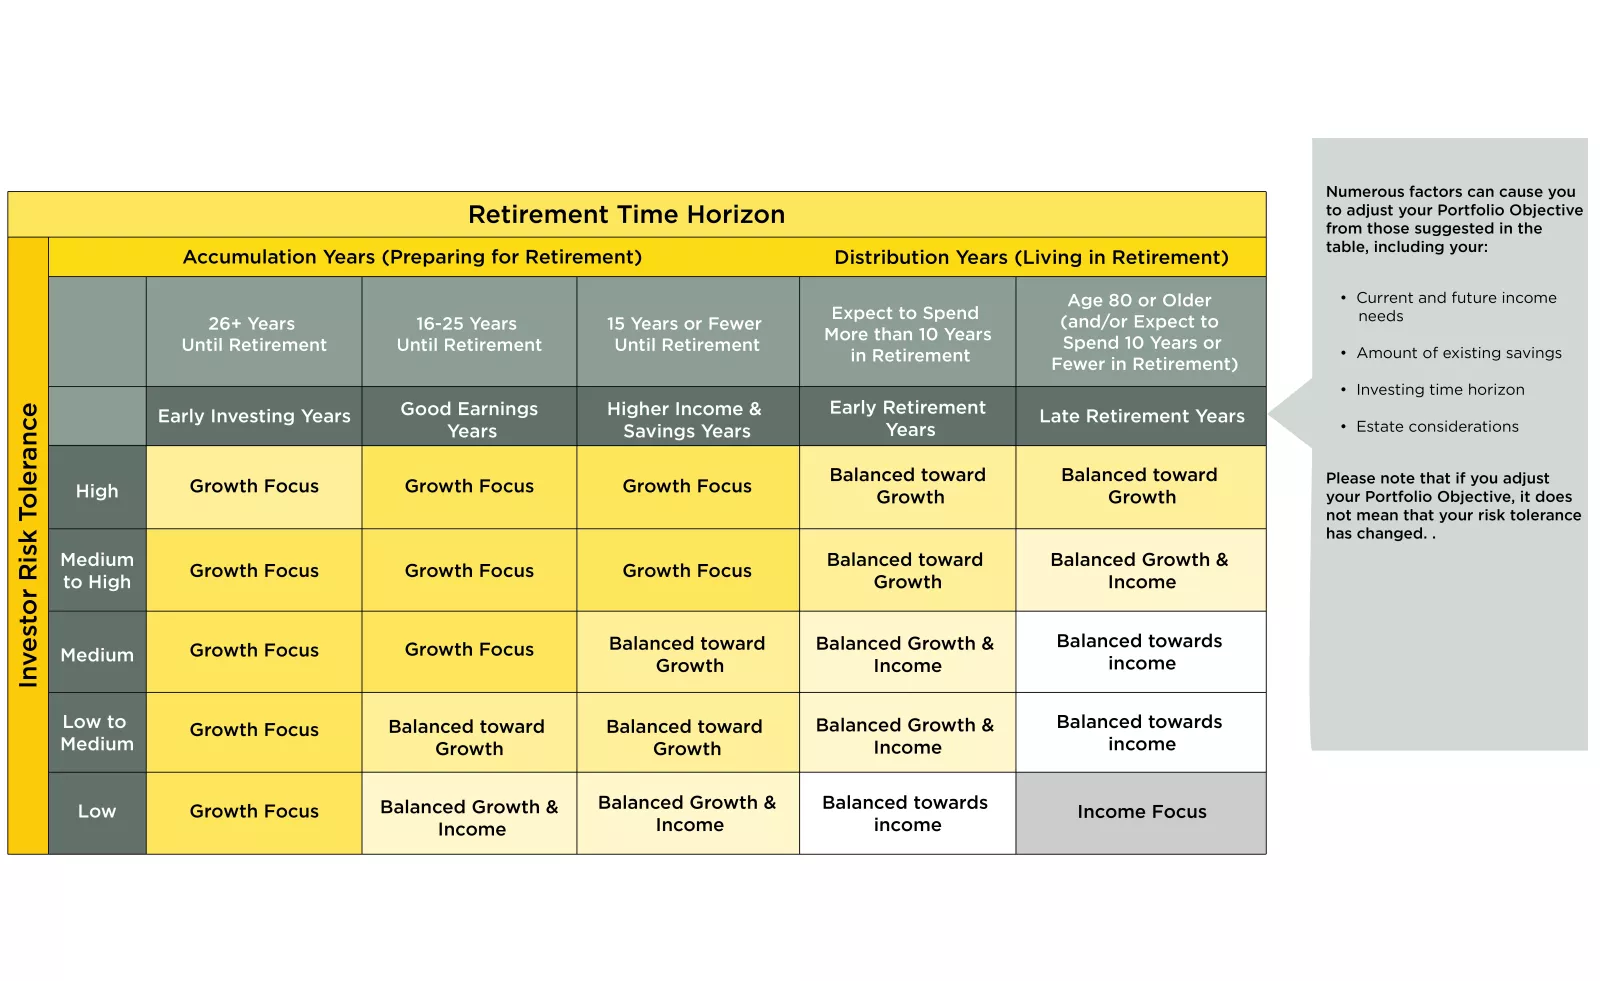
How you would define the objective of your portfolio depends on your time frame and your risk-tolerance.
The following table gives a good representation of portfolio objectives dependent on the two factors:
Now that you have determined what your investment objective is, you can decide on what assets you need to buy for your portfolio. You can choose from within stocks, bonds, derivatives and alternate investments.
Before you choose what you want to buy, however, you have to ascertain whether the portfolio will be actively or passively managed.
Stocks
Within Stocks, you can choose in between many different types, a few of which are:
Blue Chip: These are mature, stable companies that are well-known globally and generally pay good and timely dividends. You would buy these for a Balanced Growth and Income Portfolio.
Penny Stocks: These are highly volatile stocks that trade more on supply and demand than market news. You would buy these if you are completely growth focuses.
Market Cap: You can purchase stocks according to their market capitalization, which basically gives an idea as to what stage of the life-cycle t is in. A smaller market-cap stock would generally be bought for a Growth Focused Portfolio, but a Large Market Cap company stock would be bought for Income purposes.
Bonds
Bonds are fixed-income instruments, which basically means that they pay a certain amount periodically. These are perfect of an income based portfolio.
One has to be careful with this assumption because not all bonds have the same risk and hence bonds with higher risk, and subsequently lower ratings, could be bought for a growth portfolio due to its price volatility.
Derivatives
You can make use of derivatives such as options, futures and swaps in your portfolio for both income and growth reasons. If you are being speculative, then you would use it for a growth portfolio, whereas if it is for hedging, you would use it protect your income portfolio.
Alternative Investments
The biggest alternative investment out there is real estate. You can buy a rental property for income purposes, or you could be more speculative and buy land in foreign countries to capitalize from capital appreciation in a growth portfolio
How to put it Together
The percentage of your portfolio value that is invested in certain types of assets described above dictates which objective your portfolio has met.
For example, 50% in growth assets and 50% in income assets leads to a “Balanced Growth and Income Portfolio”.
Adjusting the percentages up and down changes the direction and objectives of the portfolio.
Conclusion
Now you have an idea as to how to go about setting up a portfolio. The main point to take away from here is to know what the objective of your portfolio is based on your risk tolerance and time-frame, and then to start filling up the portfolio with income or growth assets according to the percentages you need to maintain.
Price ceiling is a government-mandated limit on the price that can be charged for a given product, such as a utility or electricity.
The intended purpose of a price ceiling is to protect the consumers from conditions that would make a vital product from being financially unattainable for consumers.
Example of Price Ceiling
American soldiers returning from World War II found apartment costs in New York to be unaffordable.
As a result, the City of New York instituted a price ceiling on rent.
Prior to the return of the American soldiers, assume that apartments had been renting for $500 a month, and there was a demand for 600,000 apartments.
Now that the City of New York has imposed a price ceiling, by law, rent prices cannot exceed $400. At the lower price, demand obviously increases to 800,000 apartments.
Who benefits and who loses from a Price Ceiling in this example?
In the above example, renters benefited from this price ceiling, as they are now able to secure an apartment for $200 cheaper.
Landlords are the clear losers in this example, as they now receive $200 less in revenue per month.
Moreover, real estate developers might no longer have an incentive to build new properties since the money they bring in might not cover expenses.
Keep in mind that landlords might be forced to cutback on certain services that were previously offered to the tenants to reflect the lack of operating income such as heat or building maintenance.
Problems involving a Price Ceiling
For a price ceiling to be effective in its intended purpose, it obviously must differ from the currently established price.
For example, if a ceiling price is imposed which is higher then the current price, then there is no practical effect, making the Ceiling useless. This means that the government has dictated a maximum price, yet companies are currently selling the product below the ceiling.
Where this becomes an issue is on the opposite side, if the government set the price ceiling below the current market price. Consider a product that currently sells for $50, and the government imposes a legal limit of $45. Suppliers of the product are now legally forced to accept the lower prices, and sell the product for $5 below their target-selling price. The incentive to sell the product at the reduced price is reduced as it cuts into their profit margins, and they might chose to discontinue production. Consumers might then face a situation where there is a shortage of available products.
The government has put into place a legal maximum allowed price, but there are no laws preventing the supplier from completely scrapping the product, or changing their production quantities.
Moreover, suppliers of this product might be forced to reduce the quality of the product to compensate for their lost revenues. The consumer suffers in the end, as they now are forced to purchase a lower quality product.
Conclusion
Price ceilings are normally imposed during periods of, or directly following economic hardship, famine or war. The government needs to step in to establish a maximum price to prevent out of control increases in price.
Price ceilings are counter-productive in the sense that it dictates the maximum price that can be charged, while ignoring the price set by the market.
In the free market, buyers wish to minimize the price they are willing to pay, and sellers wish to maximize their revenues, hence both buyers and sellers compromise, and establish a price at which everyone is as satisfied as possible.
A price ceiling can have unintended consequence of ruining the free market by forcing suppliers to cut back on their product, produce inferior versions, or simply disband the product altogether.
Buyers now are faced with a potential shortage of the product and may even be forced to secure the product through illegal means, such as looking in to the black market.
Economists have a difficult time presenting a strong benefit to price ceilings, as a government imposed maximum price often goes against the free hand of the market.
Key Words: Price Ceiling, New York City, Real Estate, Product Pricing, Revenue, Government Intervention
“Greed is good, greed works.” These the famous words uttered by fictional corporate raider Gordon Gecko in the epic film ‘Wall Street.’ The 1980s was the decade of corporate raiding and Gecko’s mentality was an accurate depiction of the times on Wall Street.
Other well-known corporate raiders such as Carl Icahn and T. Boone Pickins went on raiding sprees, ruthlessly taking over companies with the intent of expelling the existing management, then doing whatever was necessary to generate a profit for themselves, at the expense of others.
How do Takeovers work?
You might wonder, how can this daunting task be accomplished? Takeover bids are attempts by a bidder (such as Carl Icahn) to obtain control of a “target” company. Firstly, the raider must manipulate himself onto the Board of Directors. This could be accomplished by purchasing a large position of the corporation’s available stock thus giving the bidder the opportunity to vote himself onto the Board. Each share equals one vote in determining who the directors will be. Soliciting proxies, which is a process of convincing existing shareholders to hand over their vote is another tactic that the raider might use for the purpose of appointing himself to the Board of Directors.
Once the raider (bidder) successfully places himself on the Board of Directors, the raider then has the ability to manage the target company or exert a significant amount of pressure and influence over the direction of the company, including selling off units and cutting the benefits of employees.
The invention of the “Poison Pill”
High profile mergers and acquisitions lawyer Martin Lipton developed the concept of “Poison Pill” in 1982 as a response to the increase of hostile takeovers and corporate raids. Lipton is quoted as saying “The early 1980s we had reached a whole new plateau of hostile takeovers and there was really little in the way of defense to them”. The term itself is derived literally from the cyanide poison that a spy could ingest in order to commit suicide, rather than risk being captured and tortured.
The corporate version of the “Poison Pill” however was not meant to prevent a hostile take over. It’s purpose, according to Lipton, was to give shareholders more time to evaluate the proposed hostile bid and to give management the opportunity to make a better informed business decision. Two of the most common “Poison Pill” strategies include:
Flip-over: Existing investors are given the opportunity to purchase the bidder’s shares at a premium.
Flip-in: Existing investors are given the opportunity to purchase additional shares in the company at a premium.
Both strategies have a specific purpose of diluting the company’s stock, thus making a hostile takeover more expensive and less attractive.
Advantages and Disadvantages of the Poison Pill
A “Poison Pill” creates a strong defense mechanism for a “target company” allowing the company to properly identify legitimate and beneficial acquisitions and weed out the actions of corporate raiders. The “Poison Pill” is also useful in slowing down the speed of potential raids. The spin-off effects are quite positive and could result in higher premiums paid to shareholders, should an acquisition be favorable.
On the downside, the “Poison Pill” has the power to greatly reduce shareholder value. For example, in 2008, Microsoft offered shareholders of Yahoo! $31 a share representing a 62% premium at the time, but quickly backed out after the effect of the “Poison Pill” defense proved to be too much to handle. This cost Yahoo! CEO and co-founder Jerry Yang his position as head of the company. Yahoo! shares have not traded anywhere close to $30 since this proposal.
Unfortunately, a “Poison Pill” could also create inefficiencies in the system and harm not only the bidder but also the shareholder. A purchaser who wishes to buy and an individual investor who wishes to sell are simply out of luck with both actions locked by the “Poison Pill.” If anything, this undermines shareholders rights, rather than supporting them.
On the other hand, one might argue the following. Consider that corporate raiders are skilled in the art of discovering intrinsic value hidden deep within the target company that is not apparent on its balance sheet nor in its current stock price. A hostile takeover can present an opportunity to install fresh, qualified and dedicated management who are willing and able to guide the company in a brand new direction.
Conclusion
At the end, it is hard to say whether a poison pill is a good thing or a bad thing. It really needs to be analyzed on a case by case basis. All we know is that is is a useful tool to fend off a hostile takeover.
Key Words: poison pill, corporate raider, Carl Icahn, T. Boone Pickins, hostile takeover, shareholder rights, Yahoo!, Microsoft, Board of Directors, flip-over, flip-on,
A straddle is an investment strategy that involves the purchase or sale of an option allowing the investor to profit regardless of the direction of movement of the underlying asset, usually a stock.
There are two straddle strategies, a long straddle and a short straddle.
How to create a Long Straddle position
A long straddle involves a long position, where an investor purchases both a call option and a put option.
The two options are bought having identical strike prices and identical expiration dates.
A profit is made if the underlying asset moves significantly from the strike price in either direction.
An investor would use a straddle strategy when the market is volatile, and the investor is unsure of the direction of a stock, but certain that a large price movement will occur in either direction.
Example of a Long Straddle Strategy
Imagine ABC is trading at $40 at the beginning June.
Earnings are set to be released at the beginning of July.
An investor has noticed in the past that the day following the release of financial results there were large movements in the stock.
An investor decides on a long straddle and places the following trades:
Buys a JUL 40 put costing $200.
Buys a JUL 40 call for $200.
The trade has cost the investor a total of $400 to enter both positions.
He can not lose more than this amount.
If ABC is trading at $50 at expiration, the JUL 40 put expires worthless, but the JUL 40 call expires in the money with an intrinsic value of $900.
The investor’s profit (or loss) is calculated by subtracting the intrinsic value from the initial investment = $900 – $400 = $300.
The investor has generated a $300 profit.
Suppose that on expiration, ABC has not moved as originally anticipated.
Both the call and put positions expire worthless and have no intrinsic value.
The investor’s profit (loss) is = $0-$400 = ($400).
The investor realizes a total loss when the stock closes on expiration date at exactly the strike price therefore having no intrinsic value.
How to create a Short Straddle position
A short straddle strategy involves simultaneously selling a put and a call of the same underlying security, having the same strike price and same expiration date.
Since the investor is selling options, their risk is theoretically unlimited.
Unlike a long straddle, an investor can expect a profit when there is little volatility.
As well, a short straddle does not provide an unlimited profit.
An investor gains when the stock closes on expiration date at the target price.
Both call and put options expire worthless but the investor profits the entire credit with the sale of both options.
Example of a Short Straddle strategy
Imagine ABC is trading at $80 at the beginning of the position in March.
– An investor would sell a MAY 80 put for $400,
– Sell a MAY 60 call for $200
Total credit received is $600
If ABC has strong buying activity for several weeks and climbs to $96 (20% gain), the MAY 80 put will expire worthless, but the MAY 40 call expires in the money, with an intrinsic value of $1200.
The investor’s profit (loss) is calculated as the difference between the initial net credit and the intrinsic value= $800- $1200 = ($400.)
The investor has lost $400 by entering this position.
Suppose the stock is still trading at $80 on the day of expiration.
The MAY 80 put and MAY 80 call options both have an intrinsic value of exactly 0.
Again, the investor’s profit is = $800 – $0 = $800.
A maximum potential profit exists when the stock closes exactly at the strike price.
Conclusion
A long straddle provides the potential for unlimited profit while the maximum loss is defined as the initial investment made.
This strategy differs from a short straddle where the maximum loss is in theory infinite.
Both strategies are used in opposite market conditions. Investment houses normally restrict the use of short strangles to experienced investors because of the risk associated to it.
In order to execute these strategies you must receive special permission from your broker to perform naked writing of options.
Before attempting any of the strategies listed, it is best to create a “paper account” where you can experiment these strategies without any risk.
An oligopoly is characterized by a small number of sellers who dominate an entire market.
Like the more commonly heard of term ‘monopoly’, the term oligopoly is derived from the Greek words oligoi meaning ‘few’, and polein meaning ‘to sell.’
All of the firms who partake in an oligopoly are considered to be “very large in terms of profit, size and client base.
Each individual company’s actions affect the others. These firms are in constant competition which each other and often marketing campaigns are created to directly the completion.
An oligopoly differs from a monopoly, as it is impossible for one company to exert significance power to dictate price.
Characteristics of companies that make up an Oligopoly
Competition amongst companies in an oligopoly tends to be fierce.
Emphasis is placed on volume (selling large amount of products at the cheapest price possible) since companies within an oligopoly usually offer similar products and services at similar price points.
As such, expensive marketing campaigns are a main focus of these companies, as this is usually one of the only ways to differentiate themselves from the competition.
Example of Oligopoly
As an example, consider the market for cellular phones in the United States.
There are four major players that account for approximately 90% of the total national cellular phone market.
These companies are:
Sprint-Nextel
T-Mobile
Verizon
AT&T
All four companies offer either identical products, or interchangeable substitutes. As an example, all four carriers offer the Blackberry smart-phone, but the specific model varies from one company to the other.
A major characteristic of firms in an oligopoly industry is the various uses of “non-price competition.” This form of competition focuses on strategies other than price in order to win customers and increase profits.
Consider a person who wishes to purchase a new cell phone (and has never owned one before.)
As discussed earlier, all four carriers offer very similar, if not identical cellular phones and plans.
This person is likely to take a trip to the local mall, where all four carriers each have a store. After gathering information from all four and realizing that each carrier charges approximately the same amount for their monthly plans, this person is likely to make their final purchasing decision based on other factors, since price plays no role in their decision making.
These factors may be extraordinary customer service received at one store, extended store hours, or even basing the decision on a memorable and funny commercial that this person recalled.
The size and scope of the four competing companies at a national level also illustrates an advantage of oligopoly, as competition is greater when there are more firms operating at the same level.
Imagine if three of the cell companies were only regional carriers, operating in specific, pre-determined major metropolis cities in the United States, rather than a national level.
This would completely eliminate the oligopoly status of the industry, and it would now be by nature a monopoly for individuals living in rural lower populated areas that lack regional carriers.
Prices might increase and consumers will be paying more compared to clients on a national network.
Conclusion
The constant but not perfect competition in an oligopoly leads to a semi-favorable outcome for the consumers, as prices are kept lower than a monopoly, but not as low as in perfect competition.
A perfect competition exists when no one company, is strong enough on its own to set it’s own terms and conditions on the market.
In an oligopoly, the main players have an incentive to collude and keep prices higher as high prices translate to higher revenue for all the players.
The key to investment success and learning about the stock market is to follow an Investment Strategy. Not picking a strategy is far more damaging than picking a bad strategy. Even with a bad strategy, you can usually outperform not having a strategy, and at least you will learn about that strategy. It’s incredibly easy to pick a strategy since even picking random stocks can be considered a strategy worth trying!
Here’s an overview of some great strategies and articles we’ve posted:
The word “monopoly” is derived from the Greek words monos (single) and polein (to sell). In economic terms, it is used to refer to a specific company or individual has a large enough control of a particular product or service that allows them to influence it’s price or certain characteristics.
Henry Ford, founder of Ford Motors had the following to say regarding his products: “Any customer can have a car painted any color that he wants so long as it is black.” Ford Motors held a monopoly in the automobile market, as they were the only automobile company that consumers can purchase from in the early 1900s.
What it takes to be a Monopoly
Monopolies exist when there is a lack of competition to produce a good or service, as well a lack of an alternative solution for the consumer.
A Monopoly must satisfy the following criteria:
Single seller: There can only be one seller, which is responsible for producing 100% of total output of the given product.
Market power: A company that holds a monopoly has the ability to change the price of the product whenever they feel is necessary. The absence of competition forces consumers to accept the new price since there is no alternative.
Firm and industry: A company that retains a monopoly is considered to be itself the industry. This means that the firm constitutes and represents the characteristics of the industry. Think of it this way: Total demand for the monopolistic company’s products equals the total demand for the entire industry.
Sources
In theory, holding a monopoly sounds lucrative, profitable and a source of power.
In fact, it is extremely difficult to achieve monopolistic status, or to compete with a monopoly.
There are circumstances that impede or greatly prevent a company from achieving a monopoly. Here are Several examples of barriers for a new company to enter and steal market share from the monopolistic comapny:
Capital requirements: Extremely large up front fixed costs often make it difficult for a new firm to enter the market and challenge the dominance of the monopoly.
Technological superiority: A monopoly that has existed for a long time has the resources, personnel and knowledge to make use of the most up-to-date and efficient technology. Having this superiority allows the monopoly to produce products at a cheaper price and more efficiently than a small firm would be able to.
Legal barriers: A government may operate a monopoly (such as electricity) and thus make it illegal for other companies.
Control of Natural Resources: controls resources that are vital to the production of the final good.
Example of a Monopoly (and its failure)
You might remember Microsoft was under the international microscope for operating as a monopoly in 1998.
The logic behind this argument was that the Microsoft web browser was pre-loaded on all Windows operated computers for free.
Competing web browsers such as Netscape (remember them?) and Opera would take a long time to download at dial-up speeds. These browsers were also available for purchase in a store for a high price.
These two aspects made it unrealistic for a consumer to use a browser other then Microsoft.
Regardless, a United State Judge concluded that Microsoft is indeed a monopoly. With the support of 240 economists, Microsoft had made the following argument which appeared in major newspapers as their defense: “Consumers did not ask for these antitrust actions — rival business firms did. Consumers of high technology have enjoyed falling prices, expanding outputs, and a breathtaking array of new products and innovations.”
Today, Microsoft has been overtaken by Apple in terms of market size and innovation.
This goes to show that monopolies cannot last forever, and it is possible for a much smaller company to challenge monopolies and steal market share.
Monopolistic Competition is characterized as a form of imperfect competition.
An imperfect competition exists when there are many sellers of a good or service but the products do not contain noticeable differences. There are several forms of imperfect competition, of which Monopolistic Competition is one.
To best explain this, let us consider athletic footwear. Nike, Adidas, Reebok and many other brands all sell basketball shoes at approximately the same price. The differences from one to the other is negligible.
Therefore, a Monopolistic Competition exists when there are many producers selling similar products to many consumers in a given market and no one company has total control and dominance.
Advantages of Monopolistic Competition
Perhaps the greatest advantage for consumers who wish to make a purchase from a Monopolistic Competition industry is the access to information.
Taking the previous example relating to basketball shoes, a consumer can easily browse the manufacturer’s website to gather information, or read reviews from Consumer Reports or by performing an internet search.
Consumers can also try on the shoes at the store and evaluate the comfort level for themselves before making a purchase.
Products in a Monopolistic Competition are differentiated through distinctive features and other promotional techniques.
For example, Kobe Bryant shoes offered by Nike are the only shoes in the market containing the purple and gold colors representative of the Laker’s uniform.
Another advantage available to consumers is the factor of availability. Amazon, an online retailer for books, DVDs and other consumer goods differentiate themselves by offering the possibility to order online and have the products mailed to the consumer. A book available on Amazon sells for approximately the same price as a book in a brick and mortar store, such as Barnes and Nobles.
Disadvantages of Monopolistic Competition
A disadvantage in a Monopolistic Competition is the concerns that the perceived prestige of the brands induces consumers into spending more on the product. This means that the name associated with the product rather than the actual benefits are the driving factor in consumers paying for the product or service.
In a monopoly (only one seller of a product) the consumer is faced with one choice from one company. Information gathering for a purchase is straightforward, and the consumer is left with no choice regarding the purchase and is forced to accept the price.
In a Monopolistic Competition, since the brands are virtually identical (recall the shoe example – a Nike pair of basketball shoes provides the same usage as Adidas) consumers must now collect and process information on a large number of different products from all different brands, keeping in mind that each manufacturer sells many different models. The total choices for shoes can be in the dozens!
Economists can argue the fact that in many cases, the cost of gathering information (time, effort, headaches) exceeds the benefit from the consumption of the brand.
Conclusion
As previously stated, a monopoly exists when there is only one supplier of a product with a lack of alternatives.
A Monopolistically Competitive Industry provides the consumer with many choices; however the difference from one company to the other is negligible.
Consider another example as toothpaste. Most consumers cannot differentiate between the Colgate brand and Crest. A consumer who does not enjoy the taste of one, is left with little alternative.
One can make the argument that a Monopolistic Competition can be considered a form of monopoly since alternative choices do theoretically exist, are the products really that much different?
Money supply is the total amount of money available in an economy at any particular point in time.
Money is required for both consumers and businesses to make purchases.
Money is defined as currency in circulation and demand deposits (funds held in bank accounts.)
Different types of money in supply
Money is classified (as “M”) into different categories ranging from M0 to M3 and with few exceptions these categories are similar worldwide.
M0 money supply refers to: physical currency, that is actual dollar bills and coins that individuals keep in their wallets (or hidden under the mattress!)
M1 money supply refers to: M0 + funds in deposit at banking institutions.
M2 money supply refers to: M0 + M1 + small time deposits (deposits of less than $100,000 that can not be redeemed before a certain date.)
M3 money supply refers to: M0+ M1 +M2 + large time deposits (deposits exceeding $100,000 that can not be redeemed before a certain date) + large liquid assets (example, stocks) + short term repurchase agreements (a form of short term investment) + institutional money-market funds (mutual fund that invests in short term debt)
Importance of Money Supply relating to Inflation
Money supply is important because it is directly linked to inflation. A country whose money supply increases rapidly will experience inflation.
A prime example of this is Zimbabwe, which has seen inflation increase in the tens of thousands percent because the government continuously printed large amounts of money.
In fact, a one hundred trillion dollar Zimbabwe bank note can be purchased on EBay for less than US$1, because even that has lost all value as the government continued to print new money.
The money supply data is not exactly a short term “market mover” because it is reported very frequently. In the United States money supply data is published weekly and often the change from one week to the next is minimal.
The data is used by economists and investors as there are complex relationships between money supply and GDP growth as well as inflation.
Historically the money supply tends to rise faster during periods of economic expansion.
Investors who closely monitor the money supply data can take this opportunity to buy stocks.
Conclusion
Perhaps the most important of the “M” figures is M2, which represents cash and cash equivalents. These funds are considered to be liquid in the sense that all holdings can easily be converted to cash if need be.
While growth in the M2 money supply does not directly indicate future spending, it can be an indication that inflation is a possibility.
A good comprehension of economics and money supply is beneficial should the M2 supply outpace economic growth, resulting in the fact that more money is now “chasing” after the same amount of goods.
Key Words: Money Supply, M0, M1, M2, bank accounts, currency, Inflation, Zimbabwe, GDP, Government Spending,
The government has two main ways it tries to influence the economy – through Fiscal Policy and Monetary Policy. Fiscal policy is the more direct approach, where the government levies taxes and subsidies to try to balance its budget while encouraging growth, while monetary policy is less direct – tweaking interest rates and modifying the money supply.
What is the Money Supply?
The money supply is the total amount of money in circulation at any given time. This number will be quite different depending on what type of money you look at. Economists generally group the “money supply” into four categories based on liquidity. The more liquid the type of money (meaning how easily it can be spent), the more restrictive its money supply category.
M0 – Cash
The most restrictive picture of the money supply is the physical cash and coins. In other words, how much currency is circulating in the economy. M0 does not count any “electronic money” (like money deposited into a checking account). M0 is not used very often anymore, since it is so easy to spend money directly from a bank account.
M1 – Cash + Checking Accounts
The next level up is M1 – or “liquid money”. This is all money which can easily be spent immediately, so it includes both cash and checking accounts. M1 is much bigger than M0, since most people usually hold a lot more money in their checking accounts than they do as cash.
M2: Cash + Checking + Saving
M2 is even bigger – it includes everything in M1, plus anything deposited into savings accounts and some Certificates of Deposit. This is in a separate category because there is another level needed before this money can be spent. Usually you would need to transfer money from your savings account into your checking account before you can spend it, making it slightly less liquid. M2 is sometimes called “Near-Money” because of the need to make a transfer before you can spend it. This is the most commonly-used measure of the money supply as an indicator of economic growth.
M2 is very commonly used as a stand-in for “Money Supply”. Because it includes most types of deposits, it includes the “Money Multipliers” from fractional reserve banking (see our article on How Money is Created for details).
M3: Cash + Checking + Saving + Money Markets
M3 is even bigger than M2 – it also includes high-interest savings accounts that put restrictions on withdrawals. These are called “Money Market” accounts (or some bigger Certificates of Deposit also qualify). With these accounts, the depositor gets a higher interest rate than a typical savings account, but they need to maintain a very high minimum balance, and are limited on how many times they can withdraw.
Because of these restrictions, money market accounts are “less liquid” than normal savings accounts.
Monetary Policy – The Big Picture
Monetary policy is set by the Federal Reserve Bank, not by Congress and the President. This is important, because it means that monetary policy is usually more removed from the normal “politics” of Washington. The Federal Reserve has two main objectives for monetary policy: encouraging economic growth, while controlling inflation.
Inflation and Growth
Inflation and growth are closely related. The economy grows when more people invest their savings to help business grow, and spend more money on consumption. This means growth is usually funded by borrowing – most businesses take out loans to help fuel their own growth.
Taking out loans causes the money supply to grow, while paying it back will cause the money supply to shrink. This means over the entire life of the loan (from initially borrowing it to fully paying it back), the money supply does not change. However, businesses will spend the loan before paying it back, putting that money into circulation.
If the economy is growing, it means more people are taking out loans today than they were yesterday. This means that the money supply grows before the rest of the economy – which causes some inflation.
Inflation caused by growth – example
Step 1: Business takes out a loan (increasing the money supply)
Step 2: Business uses the loan to hire a new employee, and pays the new employee their first paycheck (putting the money into circulation)
Step 3: The business provides a service to one of its clients, and gets paid for it (generating a profit)
Step 4: The business pays back its loan
In this example, the business pays its employee, and the employee spends their paycheck before the business gets paid by its client, and pays back its loan. This means that while businesses take out loans to drive growth, that money enters the economy before new value is added (meaning the growth the business causes). In the time between when the employee is paid and the business provides its service to the client, money was added to the economy, but no growth was added. More money but no growth means a small amount of inflation.
This same cycle is repeated millions of times every week, with people and businesses taking out and paying back loans. Since there will always be a time delay, the money supply needs to grow before the rest of the economy: the source of “Inflation by Growth”.
Runaway Inflation
Runaway inflation is what happens when this balance breaks. If too much money enters the money supply before it starts to get paid back, businesses start counting greater and greater “expected” inflation in their business plans. This means businesses start raising their prices more and more just to make sure they can afford their expected higher costs, forcing all other businesses to do the same.
This means prices continue to rise without any extra value added to the economy. In real terms, the effect is that individual’s savings loses its value, and paychecks are worth less.
The Federal Reserve uses monetary policy to maintain the balance between inflation and growth: encouraging businesses to borrow and grow, but deterring runaway inflation.
Tools of Monetary Policy
The Federal Reserve has three tools at its disposal when determining money supply: Interest Rates, Reserve Requirements, and Bond Buying.
Manipulating Interest Rates
This is the biggest tool in the box. The Federal Reserve directly sets what is called the “Federal Funds Rate”, which is the interest rates at which banks lend money to each other. This is the baseline “risk free” interest rate for banks, so if the Federal Funds rate goes up, all other interest rates go up, discouraging borrowing. If the Federal Funds rate goes down, all other interest rates go down, which encourages borrowing.
Every month, the Federal Reserve monitors all economic data across the United States, and meets to discuss inflation and growth levels. If it looks like inflation is pushing too high, they will increase the Federal Funds rate. This will decrease the total number of new loans that people and businesses take out, pushing down the inflation rate.
If it looks like the economy is struggling to grow, they do the opposite – lowering the federal funds rate to encourage borrowing and growth. The Federal Reserve changes the interest rates frequently to match the economy – there will be an announcement of the next month’s policy (go up, go down, or stay the same) every month.
Reserve Requirements
There are limits to how much can be done just by tweaking interest rates. For example, if there is high inflation but low economic growth, both raising and lowering the interest rates look like bad options.
Another tool they can turn to is changing the reserve requirements for banks. At the end of each day, banks need to keep a certain percentage of deposits “in the vault”, or not loaned out. This is called the “Reserve Requirement”, and it puts a hard limit on how much money banks can loan out at any given time.
If inflation is high but growth is low, the Federal Reserve can lower the reserve requirement. This will let banks make more loans to fuel growth, but still keep the interest rates high to try to fight inflation. This is a one-way tool – if the Federal Reserve lowers the Reserve Requirement, when the economy does start growing again they will need to raise it back up (or risk not being able to use this tool in the next crisis). Reserve Requirements do not change very often – usually less than once per decade.
Bond Buying
Bond Buying, or Quantitative Easing, is the most extreme form of monetary policy. This is a new tool that was developed in response to the 2007 economic crisis, when inflation and growth were both low, but interest rates could not be lowered.
When investors and businesses think that the economy is shrinking, they tend to pull their money out of markets and into “risk-free” assets like bonds, where they have a guaranteed return. Buying bonds in large numbers decreases the money supply, since it pulls the money out of banks and circulation. Less money available means less loans, and less growth overall – the money supply needs to be growing for the economy to grow.
For this tool, the Federal Reserve buys huge quantities of bonds from the Treasury, then immediately sells then on the open market. This floods the Bonds market, lowering the prices (and returns) for bonds. Business and investors then see bonds as a “less profitable” investment, pulling their money back into other businesses and investments, increasing the money supply, and opening the door to growth.
Modern Portfolio Theory (MPT) is an investment theory whose purpose is to maximize a portfolio’s expected return by altering and selecting the proportions of the various assets in the portfolio.
It explains how to find the best possible diversification.
If investors are presented with two portfolios of equal value that offer the same expected return, MPT explains how the investor will prefer and should select the less risky one.
Investors assume additional risk only when faced with the prospect of additional return.
In brief, MPT explains how investors can reduce overall risk by holding a diversified portfolio of assets.
Assumptions of MPT
• Asset returns are normally distributed random variables.
• Investors attempt to maximize economic market returns.
• Investors are rational and avoid risk when possible.
• Investors all have access to the same sources of information for investment decisions.
• Investors share similar views on expected returns.
• Taxes and brokerage commissions are not considered.
• Investors are not large enough players in the market to influence the price.
• Investors have unlimited access to borrow (and lend) money at the risk free rate.
Efficient Frontier
• One of the most important and widely used concept of Modern Portfolio Theory
• Every possible combination of assets plotted on graph.
• Plots return % vs Risk % (Standard Deviation)
• Optimal portfolio lies on the efficient frontier curve (parabola).
• All individual assets represented by gold dots are plotted inside the efficient frontier.
• The “tangency portfolio” represented by the red dot represents the most efficient combination of assets.
• The diagonal line represents a “risk free” asset- An asset that has a guaranteed return.
• The CAL (Capital Allocation Line) displays the return an investor should make by taking on a variable level of risk.
Limitations of Modern Portfolio Theory
Modern Portfolio Theory takes in to account many assumptions which are not always correct in the real world. As an example, the theory assumes that asset returns are normally distributed random variables. A real life examination indicates this is often far from true.
In many cases there are many large swings which invalidates the theory. Another major flaw in the theory relates to the assumption that all investors have access to the same information.
This is far from true. Many online publications such as Wall Street Journal or Bloomberg charge members to access their sites. Investors who do not pay an additional fee can be left in the dark when it comes to news.
As always, as an investor it is best to never jump to one conclusion based on one theory. An overall analysis should include much more information than just an efficient frontier.
Gross Domestic Product, or as it is most often simply referred to as ‘GDP’ is the combined value of ALL goods and services produced within a given country in a given time period.
What does “ALL” mean? It is literary every product produced; every computer, car, phone, shoe, stuffed teddy bear, and so on.
The GDP also includes government spending and net exports. GDP is calculated per quarter, and the sum of all 4 quarters represents the annual GDP. As of 2010, the United States has the largest GDP at $14.2Trillion.
In February 2011, Japanese economists confirmed that China has now overtaken the United States, and now boasts the world’s strongest economy, mostly due to its $5.87 Trillion GDP. Japan “conceded” to accept the third highest GDP of $5.47Trillion GDP.
The GDP is one of the most important economic indicators used to evaluate the health of an entire economy, and this figure is of great concern to everyone.
Investors, traders and concerned individuals are glued to the cable business network CNBC for live results each quarter.
Within seconds of the release of the GDP figures, stocks, bonds and other tradable instruments are affected, as traders react to positive data by buying or negative data by selling.
Calculating GDP
In terms of calculating GDP, there are two approaches:
The simpler of the two is referred to as The Expenditure Method, which is the sum of total consumption, investment, government spending and net exports.
The other approach is The Income Approach, which yields a similar number, but is more complex in its calculations.
For simplicity, this article will further expand on the “ExpenditureMethod.”
This method calculates the output of a nation by summing up all the money spent in it.
Want a different way to think of this concept? The total value of all goodssold can also be tabulated by examining the total money spent in purchasing these good.
The formula that economists most often use in calculating the GDP is:
GDP = C + I + G + (X-M)
Where:
C= Personal consumption expenditures; refers to the total dollar sum of goods and services consumed by individuals.
I= Gross private domestic investment; has three separate components:
Expenditures by firms for equipment;
Expenditures by individuals and firms on apartments, factories, buildings;
The dollar sum of the change in a firms inventory from the previous year (since goods are produced but not necessarily sold right away)
G= Government consumption and gross investment expenditures; refers to the total dollar sum of all acquisitions of goods and services for current use in order to satisfy the needs of all members of the community. Examples of include national defense, environment protection, education, healthcare, infrastructure etc.
X= Gross exports of goods and services; is the total dollar value of the sum of all goods and services manufactured within a country that is intended for and to be consumed in another country.
M= Gross imports of goods and services; is the total dollar value of the sum of all goods and services manufactured within another country that is intended for and to be consumed in the host country.
What does GDP tell us?
The word “recession” has been used very often in the media in the past few years, and even individuals who have little financial background can understand that a recession is not a good thing.
A recession is defined as two consecutive decreases of quarterly GDP.
The most recent financial crisis is said to have officially began in 2007, and affected economic output worldwide, thereby shrinking the GDP figures from dozens of countries such as the United States, Australia, Canada, Belgium, United Kingdom, Germany, Israel and many others. Latvia was the most affected and saw its GDP contract by over 25% over 2 years.
How is GDP used?
GDP per capita (total GDP dollar amount divided by the entire population) is often used by government and economic policy makers very closely.
This data aids in the development of appropriate economic policies. Policy makers must come up with suitable policies (for example: decrease the tax margin or increase the borrowing rate) that reflect the trend that is represented in GDP per capita calculation.
As an example, consider an economy that has been experiencing a decreasing GDP per capita over several quarters. This figure forces governments to come up with policies that will hopefully facilitate economic growth such as income tax breaks, or stimulus program. The United States government often will utilize this fiscal policy in when their GPD per capita suffers.
Conclusion
As powerful as this measurement is, some economists argue that the GDP is not an appropriate measure of the strength of an economy. Comparing the GDP of one country to another can be flawed because comparing the figures alone does not take in to account differences in the quality (and price) of the goods and services in each respective country.
Regardless of how an economist chooses to use the GDP figure, it remains a valuable tool to express total economic output, as GDP was developed specifically for this purpose.
Fiscal policy is the use of government spending to influence the economy.
Government receives revenue from several sources including:
taxes collected
money borrowed by issuing debt (a.k.a bonds)
printing additional money
using up reserved funds
the sale of fixed assets (for example selling government owned land to a corporation for development).
Fiscal policy differs greatly from monetary policy, which is concerned with controlling the money supply and interest rates.
Fiscal policy refers to the use of government funds to influence economic objectives such as maximizing employment, stabilizing prices and economic growth.
How is fiscal policy used?
There are three possible scenarios of fiscal policy:
Neutral stance of fiscal policy. This occurs when there is a large tax revenue and a balanced economy. Government spending is not financed by issuance of debt, and the fiscal policy has a neutral effect on the level of economic activity. The government is essentially choosing not to use the income earned from taxation to directly influence the economy.
Expansionary stance of fiscal policy. This is a situation where government spending is larger than tax revenue, thus the government needs to borrow money. This policy involves government attempts to increase aggregate demand (total demand for final goods and services in the economy.) The policy involves lowering taxes and/or higher government spending.
Contractionary fiscal policy. This occurs when government is spending less than the total tax revenue it receives. The policy is a result of raising taxes and/or reducing spending.
The process
Fiscal policy is connected to the government’s budget. The budget is simply the government’s financial “roadmap” for the upcoming year, and is similar to an individual or corporate budget in the sense that it determines projected income and spending.
The government prepares two sections of the budget:
The revenue aspect, which is an estimate of the total amount of money it expects to collect.
The expenditure aspect, outlining how much money the government expects to spend during the fiscal year.
These annual budgets also announce the government’s fiscal (and economic) targets.
Economic predictions for the upcoming year are introduced, and as such the appropriate fiscal strategies are presented for dealing with the conditions.
Fiscal policy in response to the 2008 economic crisis
The global economy entered a severe recession, caused by the financial crisis and a loss of consumer confidence.
The downtown was brought upon by the collapse of the housing bubble in the United States, affecting virtually all countries worldwide. The economic downtown affected financial markets, weaker commodity prices and a severe drop in international trade.
Many nations such as the United States, Germany, France and Australia have enacted a fiscal stimulus plan to deal with the financial crisis. These nations have used a distinct combination of government spending and tax cuts to boost the economy at least in the short term.
This follows the idea that deficit spending in the short term will lead to a higher tax revenue which will be sufficient to cover the debt incurred to finance the deficit spending.
As of 2011, many countries have exited the recession, unemployment levels have decreased, and corporate profits have increased.
Many credit the fiscal policies of the government for this turn around, which provided short-term relief and momentum, and allowed the economy to begin improving.
Disadvantages of Fiscal Policy
Fiscal policy has several drawbacks that are important to mention.
The most important being that conducting fiscal and economic studies are time consuming, thus the time delay between fiscal policy changes and its impact on the economy can take several years. Consider a government that deems a tax cut is necessary to its fiscal policy. Such a law must go through the proper channels of government and may take months or years to be implemented. It is possible that by this point the economy has worsened and requires a different course of action. As well, many economists argue that a change in fiscal policy can take at least two years before its effects are noticed.
Conclusion
Fiscal policy remains a closely watched data by investors because changes to the fiscal policy often involve a need to change or alter investment strategies.
Anyone who pays attention to politics will notice that the opposition parties often criticize the government’s fiscal policy, demonstrating how important a policy is in determining the short and long-term economic viability of the nation.
The Expected Return is a weighted-average outcome used by portfolio managers and investors to calculate the value of an individual stock, or an entire stock portfolio.
Expected Return of an individual stock
A stock analyst has conducted a thorough amount of research on company XYZ and has come up with the following conclusion: XYZ could experience on of the following outcomes:
1. Rise 15%
2. Rise 25%
3. Fall 5%
The analyst has also concluded that:
Scenario 1 has a 55% of occurring
Scenario 2 has a 35% chance of occurring
Scenario 3 has a 10% chance of occurring
Using the above information, the stock analyst can make a more accurate prediction using all three scenarios in a weighted average to calculate the “Expected Return” as follows:
where:
E[R] = Expected return of the stock
N= Number of scenarios
Pi= Probability of state i
Ri= Return of the stock in state i.
In simpler terms, Expected Return is equal to the sum of all the different outcomes calculated by multiplying the probability of each individual given return by their corresponding probability.
Based on using all the given scenarios, the stock analyst has concluded that XYZ has expected return of 16.5%.
Expected Return of a Portfolio
After a prudent analysis of all stocks in a client’s portfolio, the stock analyst has come up with the expected return of individual US equities, as well as the weight of each asset (that is, the share of each asset in the portfolio) which is summarized below:
Stock
Expected Return
Weight of stock in total portfolio
Apple Corp (AAPL)
-6%
15%
Wal-Mart (WMT)
18%
20%
Google (GOOG)
29%
35%
Amazon.com (AMZN)
-16%
10%
Exxon Mobile (XOM)
3%
20%
Total = 100%
Expected Return of portfolio is computed as follows:
Where
E(Rp) = Expected return on the portfolio
Ri = Return on asset i
Wi= Weighting of component of asset i
In simpler terms, Expected Return of Portfolio = Sum of all Returns multiplied by their individual weights
Based on the given returns and weighting of each stock, the portfolio manager has concluded that the portfolio has an expected return of 11.85%
Conclusion
Expected Return provides a mathematical answer when combining all the given scenarios of a stock (or portfolio) performance.
The actual return of a stock may be one of the given scenarios, but it is also possible that the actual return will not be close to a predicted scenario.
Portfolio managers and investors need to closely keep track of all assets owned and take immediate action when required.
An investor might consider selling an asset if it exceeds the Expected Return, or if the Expected Return is disappointing.
If a stock is declining but an investor is confident in his analysis, then it might present a good opportunity to purchase additional shares, to hopefully make some money in the future.
Key Words: Expected return, Expected return of stock, Portfolio expected return, Probability, Rate of return,
A Portfolio Manager is a professional investment advisor who manages his clients’ assets.
A Portfolio Manager is expected to keep a watchful eye on all his client’s investments and take corrective measures when appropriate should the market turn in the wrong direction resulting in a decrease of the total value of the portfolio.
How to evaluate a Portfolio Manager
A portfolio manager must meet two conditions:
He/ She should be registered with an investment authority
He/ She should be certified to act as a manager
A portfolio manager might not necessarily have an educational background in finance or accounting, but certifications in the field of investment (such as the Chartered Analyst (CFA) program) are good to have.
A portfolio manager working on behalf of a bank or an internationally recognized firm such as Merrill Lynch has access to investment products that independent advisors do not.
It is important to include this information in your analysis of an advisor.
A good way to evaluate a manager is to ask many relevant questions pertaining to your own personal financial situation and your financial goals. Examples of questions to ask are:
How often will I receive communicate from you?
How often will you make or suggest changes to my stock portfolio?
How many clients do you have? Will you be too busy to fully take care of my needs? Do you understand the needs of clients in my financial situation?
Is there a minimum amount that I am required to deposit in order to invest?
What is your commission structure? Are there any fees that I should be aware of?
Who audits your firm’s financial activities?
How long have you been with your current employer and what happens if you leave organizations? Will my fund be transferred, or will I be assigned a new investor?
Are there any fees or penalties if I pull out my money?
Questioning the portfolio manager’s specific knowledge of investment management is also important to make sure you are dealing with an individual who has enough knowledge of the market to suit your needs.
More qualified managers are able to answer questions in a more confident and informed way, such as:
How often will you perform an efficient frontier analysis (advanced theory of portfolio analysis) of my portfolio?
What do you envision the beta and expected return for my portfolio?
What was the worst performing stock you purchased for your clients and what did you do about it? How did you remedy the situation? How have you changed your strategies based on this occurrence?
If I am not satisfied what are some “exit routes”?
Do you offer the opportunity to hedge my portfolio with options?
What are your short and long term views of currency fluctuation relating to my personal portfolio?
Conclusion
When evaluating a prospective Portfolio Manager it is important to understand their investment philosophy and make sure that it meshes well with your financial situation and objective.
A Portfolio Manager who believes in speculative investments and penny stocks might not suitable for a client who is close to retirement and requires stability.
Portfolio Managers who partake in activities outside of work relating to investments, such as writing an opinion column for a newspaper, hosting a radio show or leading financial workshops and seminars demonstrate that they have a firm, real-world understanding of investing, and would hopefully be able to manage your investments in a professional, successful manner.
Selecting an investment manager active in many forms of communication will allow a client to gain a more detailed and complete understanding of the manager’s philosophy and personality to determine if the client will feel comfortable in the relationship.
Elasticity is one of the most important terms in economics, and has a plethora of uses. Economists define elasticity as the ratio of the percent change in one variable to the percent change in another valuable.
Its purpose is to measure how one variable responds to changes in another variable.
As an example, consider a company that sells 100 units of a product for $20 each. Elasticity is used to explain what will happen to sales, if the price of the product is increased to $21 a unit.
An “Elastic” variable is when a variable (sales of the newly priced unit) responds “a lot” to small changes in the other parameter (price.)
Contrary, an “inelastic” variable is when a variable (again, sales) responds “very little” to changes in the other parameter (price).
This article will showcase examples to illustrate the formulas provided.
Price Elasticity of demand
Price elasticity of demand measures the change in percentage of demand caused by a percent change in price.
If the elasticity is between 0-1, demand is said to be inelastic (little change).
Greater than 1, demand is said to be elastic (great change).
As a note, it is common that the formula will yield a negative value, thus we concern ourselves with its positive value (i.e absolute value).
Elasticity (Ed) can be calculated as follows:
% change in quantity demanded
Ed = __________________________
% change in price
Example: A company has conducted a survey that indicates consumer responses to a hypothetical increase in their price. The company has discovered that if the price is increased from $100 to $106 (representing a 6% change), the quantity demanded will decrease by 8% (from 100 units sold to 92 units.)
Ed = (-8% / 6%) = -1.33
Since 1.33 is greater than 1, we can conclude that the demand is elastic, meaning that the change in demand caused by the change in price is considered “a lot.”
We can also calculate the effect of the change on price on revenue to get another view of what the Elasticity of demand means:
Old price, total revenue = 100 units sold at $100 = $10,000
New price, total revenue = 92 units sold at $106 = $9,752
Income Elasticity of Demand
Income elasticity of demand (IEOd) measures the response of a given good to a change in the income of its existing clients. It is calculated as follows:
% change in quantity demanded
IEOd = _____________________
% change in real income
Example: A company has conducted marketing surveys and discovered that if a consumer group’s income increases by 15%, the demand for the given good increases by 25%.
25%
IEOd = _____ = 1.66
15%
A negative Income Elasticity of Demand is generally associated with “inferior goods.” The increase in income results in a decrease in demand for these products that are deemed to be of an inferior quality. Examples of such products may be bus services, hamburger meat or generic brand soda. When income rises, the consumer may opt to purchase an automobile, steak, and brand name cola, since they can now afford these extra luxuries.
A positive Income Elasticity of Demand is associated with “normal goods.” An increase in income will lead to an increase in demand, for example tobacco has been calculated to have an elasticity of demand of 0.64. An elasticity of greater than 1 is considered a “luxury good” for example a Mercedes Benz automobile or an Armani suit
A zero income elasticity occurs when an increase in income does not associate with a change in the demand for a good. For example these are products that are essential to live, such as fresh vegetables and milk.
Conclusion
Elasticity is a widely used economic theory that has an extremely large range of uses and applications. Other examples of how elasticity is used include its effect on international trade, analysis of advertising on consumer demand and analysis of future consumption patters.
If you own a bond or manage a bond portfolio, chances are that will you be following daily interest rates. You know that bond prices increase when rates rise, and decrease when rates fall. But how do you measure the bond’s price sensitivity to such rate fluctuations? The answer is duration.
Duration measures the percentage change in the price of a bond (or value of a bond portfolio) due to a change in market interest rates (also known as the yield).
Originally developed by Frederick Macaulay in 1938, it has become the standard measure of interest rate risk amongst practitioners in the fixed-income portfolio management profession, and has evolved into several variations used in the industry. Duration also plays an important role in bond immunization strategies.
Duration measures include Macaulay Duration, Modified Duration, Key Rate Duration, and Effective Duration.
Macaulay Duration
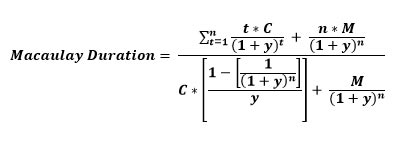
Being the first duration measure developed, it was defined by Frederick Macaulay as the present value of the weighted average term to maturity of cash flows from a bond, and as such was interpreted in temporal terms (number of years).
Formula
Where,
n = frequency of Coupon Payments
t = time to maturity
C = Coupon Payment
y = required yield
M = Maturity (or Par) Value
P = Bond’s Price
Note that the denominator in the above equation is the formula for determining the present value or price (P) of the bond.
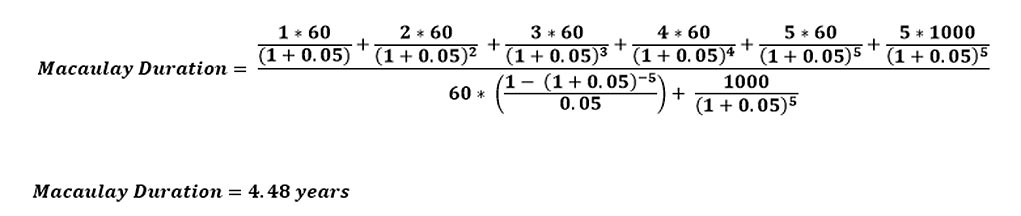
Example
Assume a 5-Year bond paying a 6% annual coupon, and yielding 5%.Using the formula above, the bond’s Macaulay duration can be calculated as:
Modified Duration
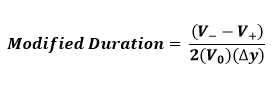
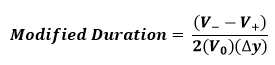
Essentially an extension of Macaulay duration, modified duration is the predominant duration measure used in the fixed income industry, and is defined as the % price change (or price-sensitivity) of a bond to a 100 basis point change in yield.
Formula
where,
V0 = Bond’s Initial Price
V+ = Bond’s price if yields decrease by
V– = Bond’s price if yields increase by = Change in yield (expressed in decimal)
YTM = Yield to Maturity (or Yield) Example
To illustrate its calculation, a hypothetical bond will be used:
Term to Maturity
10
Coupon Rate (annual)
9%
Yield
6%
Face Value
$100
Initial Bond Price
$122.08
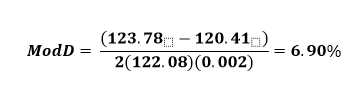
If we assume a 20 basis point change in yield modified duration can be calculated as:
Remember that this is the % price change for a 100 bps change in yield. Next, we show how to use this result to estimate the % price change for a yield shift of any magnitude.
Formula and Example for Estimating % Price Change Using Modified Duration
For example, assume that the yield for the bond above shifts from 6% to 8% (an increase of 200 basis points):
Therefore, a 200 bps increase in the yield will cause the price of the bond to approximately drop by 13.8%
Limitations of Modified Duration
We can see the first limitation of modified duration with the following graph:
Large shifts in yield will cause modified duration to be significantly inaccurate. Moreover, duration (as represented by the tangent line above), will underestimate bond prices with respect to yield shifts.
Another disadvantage is that modified duration does not account for option-embedded features in certain fixed-income securities (e.g., convertible bonds or mortgage-backed securities) which may cause future cash flows to change with shifts in yields.
Key-Rate Duration
Key-Rate Duration is computationally similar to Modified Duration, except that it accounts for non-parallel shifts in the yield curve. For example, the magnitude of a yield shift will differ for a 1-Year treasury compared to a 10 Year bond. Using key rate duration, we can assume non-parallel yield shifts across different maturities, thus obtaining a more accurate (and realistic) measure of interest rate exposure to a bond portfolio.
Effective Duration
This duration measure accounts for the embedded option features in certain fixed-income securities such as convertible securities or mortgage-backed securities, whose future cash flows could change with shifts in interest rates.
Conclusion
Duration measures the price-sensitivity of bonds due to changes in interest rates. It plays an important role in managing interest rate risk exposure. However, due to convexity issues, care must be taken when interpreting its results when assuming large shifts in the yield. Furthermore, when dealing with option-embedded bonds or an assumption of non-parallel yield shifts, effective duration and key-rate duration can provide better estimates of price sensitivity.
Dupont Analysis breaks the Return on Equity into several different components in order to analyze where the returns are coming from.
Return on Equity (ROE) is one of the most important pieces of data that investors and creditors use to evaluate a company’s potential to grow and profitability.
ROE is typically calculated as net income divided by shareholder’s equity.
The company’s net income can be found on the income statement, while shareholder’s equity is found on the balance sheet.
ROE reveals how much profit a company has generated using the cash that shareholder’s have invested in the company. In the 1920s,
DuPont Corporation, one of the world’s largest chemical companies, developed a twist on ROE and breaks it further down in to three components: net profit margin, asset turnover and the equity multiplier.
DuPont Formula
The DuPont Model is calculated by multiplying all three components as follows:
Using data collected from Google’s investor relations site (investor.google.com) we are able to gather the following necessary information (in thousands of dollars) for Google’s year-end data 2010:
Total Revenue: $29,321,000
Net Income: $8,505,000
Total Assets: $57,851,000
Shareholder’s Equity: $46,241,000
Net Profit Margin: Net Income ($8,505,000) ÷ Revenue ($29,321,000) = 0.29
Finally, The DuPont Model is calculated as [0.29*0.507*1.251] = 0.2068, or 20.68%
Results of DuPont Example
A 20.68% ROE is a good indication of Google’s ability to generate profit.
Stock analysts can use the DuPont Model to make a side by side comparison of two companies in a similar industry with a similar ROE.
Breaking down ROE in to three categories is especially useful in this situation.
If we were to calculate the ROE of Google without the equity multiplier, we would see how much they have earned if it was completely debt free.
In this case, the ROE would be = 0.29*0.507=0.147 or 14.7%.
This indicated that in the year 2010, 14.7% of the ROE was generated from sales, while 5.98% was due to returns earned as a result of borrowing money to finance activities.
When evaluating two companies, the more favorable of the two would obviously be the company with a higher percentage of internally-generated sales.
The Direxion Small Cap Bear 3x is a triple-leveraged ETF offered by Direxion Investments that seeks to negatively triple the returns of the Russell 2000 stock index.
About
All Direxion ETFs work on a daily timeframe; the TZA ETF’s goal is to give -300% of the return of the small-cap stocks featured in the Russell 2000; this does not mean it will negatively triple the returns over a month or over a year. For example, this particular ETF has lost about 95% of its value since inception because this index has gone up over that time frame. However, if you were to day trade, it may have still been possible to make money with TZA.
Related ETFs
TNA: The Direxion Daily Small Cap Bull 3x, provides approximately the opposite returns of the TZA
Straight line depreciation is the most commonly used and simplest form of depreciation. To calculate straight line depreciation, start with the purchase or acquisition price of an asset and subtract the salvage value. Then you divide by the total productive years the item/asset can be expected to be useful to the company. The expected life of an asset is called its “useful life” in accounting jargon.
Straight Line Depreciation Calculation
(Purchase Price of Asset – Approximate Salvage Value) ÷ Estimated Useful Life of Asset
Example of Straight Line Depreciation:
Lets say we buy a computer for your business at a cost of $5,000. As of today, you can expect to sell it when it is no longer useful (salvage value) at around $200. Federal accounting rules allow computers to have a maximum life of five years. In the past, your company has upgraded computers at least every three years. Since the shorter period is more realistic and it allows you to take a bigger tax deduction, you choose 3 years for the useful life. Using that information, you would plug it into the formula:
($5,000 purchase price – $200 approximate salvage value) ÷ 3 years estimated useful life
Therefore, your business can take a depreciation charge of $1,600 annually for three years if you were using the straight line method.


 The most restrictive picture of the money supply is the physical cash and coins. In other words, how much currency is circulating in the economy. M0 does not count any “electronic money” (like money deposited into a checking account). M0 is not used very often anymore, since it is so easy to spend money directly from a bank account.
 Inflation and growth are closely related. The economy grows when more people invest their savings to help business grow, and spend more money on consumption. This means growth is usually funded by borrowing – most businesses take out loans to help fuel their own growth.
 Runaway inflation is what happens when this balance breaks. If too much money enters the money supply before it starts to get paid back, businesses start counting greater and greater “expected” inflation in their business plans. This means businesses start raising their prices more and more just to make sure they can afford their expected higher costs, forcing all other businesses to do the same.
 There are limits to how much can be done just by tweaking interest rates. For example, if there is high inflation but low economic growth, both raising and lowering the interest rates look like bad options.


 A Portfolio Manager is a professional investment advisor who manages his clients’ assets.