1 – 100      101 – 200      201 – 300      301 – 400      401 – 500
Revenue
Profit
Profit
Rank Company Symbol
($ millions)
($ millions)
Margin
301 Family Dollar Stores FDO
8,547.80
388.4
4%
302 Reynolds American RAI
8,541.00
1,406.00
16%
303 Henry Schein HSIC
8,530.20
367.7
4%
304 Dover DOV
8,501.90
895.2
10%
305 CenterPoint Energy CNP
8,450.00
1,357.00
16%
306 Gilead Sciences GILD
8,385.40
2,803.60
33%
307 Ashland ASH
8,370.00
414
4%
308 Stryker SYK
8,307.00
1,345.00
16%
309 Hertz Global Holdings HTZ
8,298.40
176.2
2%
310 Assurant AIZ
8,272.80
545.8
6%
311 Kinder Morgan KMP
8,264.90
594.4
7%
312 Energy Transfer Equity ETP
8,240.70
309.8
3%
313 Autoliv ALV
8,232.40
623.4
7%
314 Republic Services RSG
8,192.90
589.2
7%
315 Reliance Steel & Aluminum RS
8,134.70
343.8
4%
316 Peabody Energy BTU
8,096.00
957.7
11%
317 Great Atlantic & Pacific Tea
8,078.50
-598.6
-7%
318 W.W. Grainger GWW
8,078.20
658.4
8%
319 Goodrich
8,074.90
810.4
10%
320 AutoZone AZO
8,073.00
849
10%
321 Visteon VC
8,047.00
80
0%
322 AECOM Technology ACM
8,037.40
275.8
3%
323 Steel Dynamics STLD
7,997.50
278.1
3%
324 Coca-Cola Enterprises KO
7,939.00
749
9%
325 Williams Companies WMB
7,930.00
376
4%
326 Commercial Metals CMC
7,919.80
-129.6
-1%
327 Hormel Foods HRL
7,895.10
474.2
6%
328 Corning GLW
7,890.00
2,805.00
35%
329 TravelCenters of America TA
7,888.90
23.6
0%
330 Sonic Automotive SAH
7,871.30
76.3
0%
331 MGM Resorts International MGM
7,849.30
3,114.60
39%
332 Thrivent Financial for Lutherans PRIVATE
7,842.80
454.6
5%
333 Becton Dickinson BDX
7,832.10
1,271.00
16%
334 Campbell Soup CPB
7,719.00
805
10%
335 Boston Scientific BSX
7,622.00
441
5%
336 Dana Holding DAN
7,592.00
219
2%
337 Oshkosh OSK
7,584.70
273.4
3%
338 Masco Corporation MAS
7,560.00
-575
-7%
339 Universal Health Services UHS
7,534.10
398.2
5%
340 Ameren AEE
7,531.00
519
6%
341 Quest Diagnostics DGX
7,510.50
470.6
6%
342 Darden Restaurants DRI
7,500.20
476.3
6%
343 Regions Financial RF
7,427.00
-215
-2%
344 Broadcom BRCM
7,389.00
927
12%
345 Owens-Illinois OI
7,358.00
-510
-6%
346 Eastman Chemical EMN
7,283.00
696
9%
347 The Pantry, Inc. PTRY
7,271.80
9.8
0%
348 Cablevision Systems CVC
7,252.30
291.9
4%
349 Dole Food DOLE
7,223.80
38.4
0%
350 Tenneco TEN
7,205.00
157
2%
351 Charter Communications CHTR
7,204.00
-369
-5%
352 Spectrum Group International SPGZ
7,203.40
3.8
0%
353 Franklin Resources BEN
7,140.00
1,923.60
26%
354 OfficeMax OMX
7,121.20
34.9
0%
355 BorgWarner BWA
7,114.70
550.1
7%
356 Alpha Natural Resources ANR
7,109.20
-677.4
-9%
357 Energy Future Holdings PRIVATE
7,040.00
-1,913.00
-27%
358 Interpublic Group IPG
7,014.60
532.3
7%
359 DaVita DVA
6,998.90
478
6%
360 Barnes & Noble BKS
6,998.60
-73.9
-1%
361 Targa Resources TRGP
6,994.50
30.7
0%
362 Cameron International CAM
6,959.00
521.9
7%
363 Winn-Dixie Stores WINN
6,929.90
-70.1
-1%
364 Calpine CPN
6,800.00
-190
-2%
365 Ecolab ECL
6,798.50
462.5
6%
366 Cliffs Natural Resources CLF
6,794.30
1,619.10
23%
367 Avery Dennison AVY
6,786.70
190.1
2%
368 Celanese CE
6,763.00
607
8%
369 NII Holdings NIHD
6,719.30
198.8
2%
370 MasterCard MA
6,714.00
1,906.00
28%
371 Jarden JAH
6,679.90
204.7
3%
372 Fifth Third Bancorp FITB
6,673.00
1,297.00
19%
373 Dollar Tree DLTR
6,630.50
488.3
7%
374 Weyerhaeuser WY
6,618.00
331
5%
375 Agilent Technologies A
6,615.00
1,012.00
15%
376 Sanmina-SCI SANM
6,602.40
68.9
1%
377 NuStar Energy NS
6,575.30
221.5
3%
378 Advanced Micro Devices AMD
6,568.00
491
7%
379 Terex TEX
6,504.60
45.2
0%
380 CMS Energy CMS
6,503.00
415
6%
381 AK Steel Holding AKS
6,468.00
-155.6
-2%
382 American Family Insurance Group PRIVATE
6,400.20
295.2
4%
383 Dillard’s DDS
6,399.80
463.9
7%
384 McGraw-Hill MHP
6,336.00
911
14%
385 Amerigroup AGP
6,318.40
195.6
3%
386 Anixter International AXE
6,270.10
188.2
3%
387 Precision Castparts PCP
6,267.20
1,013.50
16%
388 Mattel MAT
6,266.00
768.5
12%
389 Omnicare OCR
6,239.90
86.9
1%
390 Corn Products International
6,219.40
415.7
6%
391 Symantec SYMC
6,190.00
597
9%
392 Advance Auto Parts AAP
6,170.50
394.7
6%
393 Core-Mark Holding CORE
6,163.40
26.2
0%
394 CC Media Holdings CCMO
6,161.40
-302.1
-4%
395 Expeditors International of Washington EXPD
6,150.50
385.7
6%
396 Mylan MYL
6,129.80
536.8
8%
397 Wesco International WCC
6,125.70
196.3
3%
398 Cognizant Technology Solutions CTSH
6,121.20
883.6
14%
399 Consol Energy CNX
6,117.20
632.5
10%
400 PetSmart PETM
6,113.30
290.2
4%


1 – 100      101 – 200      201 – 300      301 – 400      401 – 500


1 – 100      101 – 200      201 – 300      301 – 400      401 – 500
Revenue
Profit
Profit
Rank Company Symbol
($ millions)
($ millions)
Margin
201 Ally Financial PRIVATE
13,642.00
-157
-1%
202 Chubb CB
13,585.00
1,678.00
12%
203 Waste Management WM
13,378.00
961
7%
204 Aramark
13,244.70
100.1
0%
205 Kellogg K
13,198.00
1,231.00
9%
206 Motorola Mobility Holdings
13,064.00
-249
-1%
207 Dean Foods DF
13,055.50
-1,575.60
-12%
208 US Airways Group LCC
13,055.00
71
0%
209 Consolidated Edison ED
12,938.00
1,051.00
8%
210 Land O’Lakes PRIVATE
12,849.30
182.2
1%
211 Edison International EIX
12,760.00
-37
0%
212 PPL PPL
12,756.00
1,495.00
11%
213 Yum Brands YUM
12,626.00
1,319.00
10%
214 Genuine Parts GPC
12,458.90
565.1
4%
215 ConAgra Foods CAG
12,395.50
817
6%
216 Parker Hannifin PH
12,345.90
1,049.10
8%
217 Marriott International MAR
12,317.00
198
1%
218 Smithfield Foods SFD
12,202.70
521
4%
219 Coventry Health Care CVH
12,186.70
543.1
4%
220 Sara Lee
12,103.00
1,287.00
10%
221 Health Net HNT
11,901.00
72.1
0%
222 Penske Automotive Group PAG
11,869.50
176.9
1%
223 Icahn Enterprises IEP
11,855.00
750
6%
224 Monsanto MON
11,822.00
1,607.00
13%
225 Thermo Fisher Scientific TMO
11,780.20
1,329.90
11%
226 CSX CSX
11,743.00
1,822.00
15%
227 Starbucks SBUX
11,700.40
1,245.70
10%
228 eBay EBAY
11,651.70
3,229.40
27%
229 Chesapeake Energy CHK
11,635.00
1,742.00
14%
230 Liberty Interactive LINTA
11,624.00
912
7%
231 Marsh & McLennan MMC
11,526.00
993
8%
232 Devon Energy DVN
11,497.00
4,704.00
40%
233 Office Depot ODP
11,489.50
95.7
0%
234 Avon Products AVP
11,291.60
513.6
4%
235 Aon AON
11,287.00
979
8%
236 Textron TXT
11,275.00
242
2%
237 Huntsman HUN
11,259.00
247
2%
238 Praxair PX
11,252.00
1,672.00
14%
239 Entergy ETR
11,229.10
1,346.40
11%
240 Public Service Enterprise Group PEG
11,191.00
1,503.00
13%
241 Norfolk Southern NSC
11,172.00
1,916.00
17%
242 Nordstrom JWN
10,877.00
683
6%
243 First Data PRIVATE
10,713.60
-516.1
-4%
244 H.J. Heinz HNZ
10,706.60
989.5
9%
245 SAIC SAI
10,657.00
59
0%
246 Xcel Energy XEL
10,654.80
841.2
7%
247 Lincoln National LNC
10,635.60
293.8
2%
248 Ameriprise Financial AMP
10,621.00
1,076.00
10%
249 R.R. Donnelley & Sons RRD
10,611.00
-122.6
-1%
250 Guardian Life Ins. Co. of America PRIVATE
10,571.30
209.9
1%
251 Applied Materials AMAT
10,517.00
1,926.00
18%
252 Stanley Black & Decker SWK
10,437.60
674.6
6%
253 Synnex SNX
10,409.80
150.3
1%
254 Jacobs Engineering Group JEC
10,381.70
331
3%
255 Peter Kiewit Sons’ PRIVATE
10,381.00
573
5%
256 Limited Brands LTD
10,364.00
850.1
8%
257 Newmont Mining NEM
10,358.00
366
3%
258 Genworth Financial GNW
10,344.00
122
1%
259 C.H. Robinson Worldwide CHRW
10,336.30
431.6
4%
260 Unum Group UNM
10,278.00
235.4
2%
261 Liberty Global LBTYA
10,246.50
-772.7
-7%
262 State Street Corp. STT
10,207.00
1,920.00
18%
263 EOG Resources EOG
10,126.10
1,091.10
10%
264 Whole Foods Market WFM
10,107.80
342.6
3%
265 Air Products & Chemicals APD
10,082.00
1,224.20
12%
266 Sempra Energy SRE
10,036.00
1,357.00
13%
267 BB&T Corp. BBT
9,998.00
1,289.00
12%
268 Mosaic MOS
9,937.80
2,514.60
25%
269 Automatic Data Processing ADP
9,879.50
1,254.20
12%
270 CDW PRIVATE
9,602.40
17.1
0%
271 SunTrust Banks STI
9,602.00
647
6%
272 Tenet Healthcare THC
9,601.00
82
0%
273 GameStop GME
9,550.50
339.9
3%
274 Motorola Solutions MSI
9,549.00
1,158.00
12%
275 URS Corporation URS
9,545.00
-465.8
-4%
276 Western Digital WDC
9,526.00
726
7%
277 VF Corporation VFC
9,459.20
888.1
9%
278 Las Vegas Sands LVS
9,410.70
1,560.10
16%
279 CarMax KMX
9,402.20
380.9
4%
280 KBR, Inc. KBR
9,261.00
480
5%
281 Visa V
9,188.00
3,650.00
39%
282 Enbridge Energy Partners EEP
9,109.80
624
6%
283 BlackRock BLK
9,081.00
2,337.00
25%
284 NRG Energy NRG
9,079.00
197
2%
285 Western Refining WNR
9,071.00
132.7
1%
286 Progress Energy
8,907.00
575
6%
287 DTE Energy DTE
8,897.00
711
7%
288 Caesars Entertainment CZR
8,834.50
-687.6
-7%
289 Reinsurance Group of America RGA
8,829.50
599.6
6%
290 Estée Lauder EL
8,810.00
700.8
7%
291 Micron Technology MU
8,788.00
167
1%
292 AGCO Corporation AGCO
8,773.20
583.3
6%
293 Sherwin-Williams SHW
8,765.70
441.9
5%
294 Bed Bath & Beyond BBBY
8,758.50
791.3
9%
295 Principal Financial PFG
8,709.60
715
8%
296 Crown Holdings CCK
8,644.00
282
3%
297 Ball Corporation BLL
8,630.90
444
5%
298 Owens & Minor OMI
8,627.90
115.2
1%
299 Ross Stores ROST
8,608.30
657.2
7%
300 Discover Financial Services DFS
8,550.30
2,226.70
26%


1 – 100      101 – 200      201 – 300      301 – 400      401 – 500


1 – 100     101 – 200      201 – 300      301 – 400      401 – 500
Revenue
Profit
Profit
Rank Company Symbol
($ millions)
($ millions)
Margin
101 Tesoro TSO
29,927.00
546
1%
102 3M MMM
29,611.00
4,283.00
14%
103 Time Warner TWX
28,974.00
2,886.00
9%
104 Northrop Grumman NOC
28,058.00
2,118.00
7%
105 DirecTV DTV
27,226.00
2,609.00
9%
106 Publix Super Markets PRIVATE
27,178.80
1,492.00
5%
107 McDonald’s MCD
27,006.00
5,503.10
20%
108 Avnet AVT
26,534.40
669.1
2%
109 Tech Data TECD
26,488.10
206.4
0%
110 Macy’s M
26,405.00
1,256.00
4%
111 International Paper IP
26,034.00
1,341.00
5%
112 Travelers Cos. TRV
25,446.00
1,426.00
5%
113 Rite Aid RAD
25,214.90
-555.4
-2%
114 Staples SPLS
25,022.20
984.7
3%
115 Alcoa AA
24,951.00
611
2%
116 Northwestern Mutual NWE
24,861.00
645.1
2%
117 Raytheon RTN
24,857.00
1,866.00
7%
118 Halliburton HAL
24,829.00
2,839.00
11%
119 Eli Lilly LLY
24,286.50
4,347.70
17%
120 Emerson Electric EMR
24,234.00
2,480.00
10%
121 Massachusetts Mutual Life Insurance PRIVATE
24,226.40
877.4
3%
122 Occidental Petroleum OXY
24,216.00
6,771.00
27%
123 AMR Corporation AMR
23,979.00
-1,979.00
-8%
124 Fluor FLR
23,381.40
593.7
2%
125 The TJX Corporation TJX
23,191.50
1,496.10
6%
126 Goodyear Tire & Rubber GT
22,767.00
343
1%
127 Xerox XRX
22,626.00
1,295.00
5%
128 Aflac AFL
22,171.00
1,964.00
8%
129 Manpower MAN
22,006.00
251.6
1%
130 Cigna CI
21,998.00
1,327.00
6%
131 Hartford Financial Services Group HIG
21,918.00
662
3%
132 U.S. Bancorp USB
21,399.00
4,872.00
22%
133 Arrow Electronics ARW
21,390.30
598.8
2%
134 Bristol-Myers Squibb BMY
21,244.00
3,709.00
17%
135 Freeport-McMoRan Copper & Gold FCX
20,880.00
4,560.00
21%
136 Nike NKE
20,862.00
2,133.00
10%
137 Kimberly-Clark KMB
20,846.00
1,591.00
7%
138 Nucor NUE
20,023.60
778.2
3%
139 EMC EMC
20,007.60
2,461.30
12%
140 United States Steel X
19,884.00
-53
0%
141 Baker Hughes BHI
19,831.00
1,739.00
8%
142 Time Warner Cable TWC
19,675.00
1,665.00
8%
143 Union Pacific UNP
19,557.00
3,292.00
16%
144 United Services Automobile Assn. PRIVATE
19,036.10
2,128.30
11%
145 Exelon EXC
18,924.00
2,495.00
13%
146 Kohl’s KSS
18,804.00
1,167.00
6%
147 Whirlpool WHR
18,666.00
390
2%
148 Capital One Financial COF
18,525.00
3,147.00
16%
149 Illinois Tool Works ITW
18,256.80
2,071.40
11%
150 Cummins CMI
18,048.00
1,848.00
10%
151 AES AES
17,759.00
58
0%
152 Southern SO
17,657.00
2,203.00
12%
153 J.C. Penney JCP
17,260.00
-152
0%
154 Apache APA
16,888.00
4,584.00
27%
155 Colgate-Palmolive CL
16,734.00
2,431.00
14%
156 Altria Group MO
16,619.00
3,390.00
20%
157 Jabil Circuit JBL
16,518.80
381.1
2%
158 Danaher DHR
16,476.40
2,172.30
13%
159 Paccar PCAR
16,355.20
1,042.30
6%
160 FirstEnergy FE
16,258.00
885
5%
161 TRW Automotive Holdings TRW
16,244.00
1,157.00
7%
162 Computer Sciences CSC
16,144.00
740
4%
163 Eaton ETN
16,049.00
1,350.00
8%
164 Medtronic MDT
15,933.00
3,096.00
19%
165 PNC Financial Services Group PNC
15,820.00
3,056.00
19%
166 Bank of New York Mellon Corp. BK
15,804.00
2,516.00
15%
167 Southwest Airlines LUV
15,658.00
178
1%
168 Amgen AMGN
15,582.00
3,683.00
23%
169 Progressive PGR
15,508.10
1,015.50
6%
170 HollyFrontier HFC
15,439.50
1,023.40
6%
171 CenturyLink CTL
15,351.00
573
3%
172 NextEra Energy NEE
15,341.00
1,923.00
12%
173 Marathon Oil MRO
15,282.00
2,946.00
19%
174 L-3 Communications LLL
15,169.00
956
6%
175 Oneok OKE
15,119.20
360.6
2%
176 American Electric Power AEP
15,116.00
1,941.00
12%
177 Viacom Viab
14,963.00
2,136.00
14%
178 Qcom
14,962.00
4,260.00
28%
179 PG&E Corp. Pcg
14,956.00
844
5%
180 PPG Industries PPG
14,885.00
1,095.00
7%
181 General Mills GIS
14,880.20
1,798.30
12%
182 Global Partners GLP
14,835.70
19.4
0%
183 Dollar General DG
14,807.20
766.7
5%
184 National Oilwell Varco NOV
14,658.00
1,994.00
13%
185 Gap GPS
14,549.00
833
5%
186 Duke Energy DUK
14,529.00
1,706.00
11%
187 Dominion Resources D
14,379.00
1,408.00
9%
188 CBS CBS
14,245.00
1,305.00
9%
189 Lear LEA
14,156.50
540.7
3%
190 Loews LOW
14,127.00
1,064.00
7%
191 DISH Network DISH
14,048.40
1,515.90
10%
192 Anadarko Petroleum APC
13,967.00
-2,649.00
-18%
193 Navistar International NAV
13,958.00
1,723.00
12%
194 Toys “R” Us PRIVATE
13,909.00
149
1%
195 Baxter International BAX
13,893.00
2,224.00
16%
196 Omnicom Group OMC
13,872.50
952.6
6%
197 AutoNation AN
13,832.40
281.4
2%
198 Community Health Systems CYH
13,817.00
201.9
1%
199 Constellation Energy CEP
13,758.20
-340.3
-2%
200 Texas Instruments TXN
13,735.00
2,236.00
16%


1 – 100      101 – 200      201 – 300      301 – 400      401 – 500


Covariance is a statistical measure of the extent that 2 variables move in tandem relative to their respective mean (or average) values.

In the investment world, it is important to be able to measure how different financial variables interact together.

Covariance can provide clues to the following two questions:

  1. Are there common factors affecting the returns of your investments?
  2. How can you measure the magnitude of this relationship?

It is calculated by taking the product of two variables’ deviations from their average values.

The practical applications of covariance are quite significant in statistics, economics, finance, and portfolio management.

Investment decision-making based on covariance analysis can have serious financial implications, and as such, it is important to be well-grounded in its understanding.


Formula of Covariance

Quite often, covariance analysis aims to assess historical relationships among variables of interest.

If we obtain a sample of monthly returns for two stocks, X and Y, covariance can be calculated as:

Covariance


Where,

Xi  = return (%) for stock X for period i

Yi = return (%) for stock Y for period i

X = sample mean or average value of X for sample n

Y = sample mean or average value of Y for sample b

n = sample size (12 observation implies n=12)

Note: the formula above is the covariance computation for a sample of data. When working with a population (the entire data), the denominator changes to (n) rather than (n-1).


Example Calculations

Assume we want to compute the covariance of a sample of monthly returns (%) for stock X and stock Y for 2010. The following table summarizes the return data, as well as all necessary calculations for both stocks:

Stock X Returns (%) Stock Y Returns (%)
Date  (%)  (%)

Jan-10

1.80

1.25

0.86

-0.59

-0.51

Feb-10

2.20

2.65

1.26

0.81

1.02

Mar-10

0.80

1.36

-0.14

-0.48

0.07

Apr-10

-1.50

-2.36

-2.44

-4.20

10.26

May-10

1.75

2.95

0.81

1.11

0.90

Jun-10

-3.65

1.78

-4.59

-0.06

0.29

Jul-10

4.75

1.85

3.81

0.01

0.02

Aug-10

1.30

2.9

0.36

1.06

0.38

Sep-10

-2.15

3.5

-3.09

1.66

-5.12

Oct-10

3.75

2.6

2.81

0.76

2.12

Nov-10

1.95

2.15

1.01

0.31

0.31

Dec-10

0.25

1.5

-0.69

-0.34

0.24

Mean Value =

0.94

1.84

Sum =

9.98


We calculate covariance using the formula above:

Covariance Formula


Therefore, there is a positive relationship between the returns of Stock X and Stock Y. In other word, the returns of both stocks tend to move in the same direction for the sample of interest


Limitations of Covariance

The major limitation of the covariance measure is in its interpretation. While we can gauge the directional relationship between the variables, the magnitude in itself, is not very informative. From the above example, a covariance of 0.91 does not tell us how strong the relationship between the returns of Stock X and Y is, and as such, our conclusions are limited. One way we can work around this shortcoming is to determine the correlation coefficient.

Another short-coming in covariance is that the result is highly sensitive to the volatility of the variables’ variances. For example, the presence of just a few outliers in a data set can significantly skew its result, rendering it as a potentially misleading statistic, in terms if interpretation.


Covariance in Portfolio Management Theory

Portfolio management theory (or Modern Portfolio Theory (MPT)), as developed by Harry Markowitz in the 1950s, makes extensive use of the covariance measure. The theory posits that an efficient frontier exists, which is derived from the expected returns and variances (or standard deviation) of sets of investment portfolios. Given varying weights in two asset classes (e.g. stocks and bonds), we can determine risk-efficient points on a graph plotting the expected returns and standard deviations of the portfolio. The line of the graph is the efficient frontier. In other words, the EF plots the maximum return possible given a level of risk (variance).

The role of covariance in MPT lies in its impact on the diversification effects of adding an individual investment, portfolio, or different asset class to an existing portfolio. Thus, given an existing portfolio, it is possible to reduce its inherent risk (for a given expected return) by adding an investment whose returns exhibits a low covariance with those of the existing portfolio.


Conclusion

Covariance is a statistical measure of the extent and direction of co-movement between two variables deviations from their respective means. It can be used to assess the association between important economic and financial data such as stock returns, equity indexes, bond returns, inflation, interest rates, and a multitude of relationships of interest. Covariance analysis can also be used to assess the diversification benefits of adding different asset classes into our portfolio. Its limitation is the difficultly in its interpretation, since the strength of the relationship cannot be strongly gauged from its result.

Given two variables or more variables of interest, we can measure the degree and direction of their linear association using correlation analysis.

A correlation of 1 indicates a perfect linear relationship, while a correlation of -1 implies a perfectly negative linear relation. A value of 0 means there is no association at all.

Correlation analysis is used extensively in the fields of statistics, economics, accounting, and finance. Some practical applications include (but not limited to):

  • Assessing the relationship between inflation, money supply, and stock returns
  • Determining the impact of including different asset classes in our portfolio on return and risk
  • Quantifying the benefits investing in foreign or emerging markets
  • Analysing correlations between exchange rates
  • Gauging the correlation between items on a company’s financial statements (e.g., the relationship between net income and cash flow


How Do We Measure Correlation

If we have a pair of data series for two independent variables, we can compute the correlation between using the following steps:

Step 1: Calculate the mean of each data series

Step 2: Calculate variance and standard deviation for each variable

Step 3: Determine the data series’ covariance

Step 4: Calculate the correlation coefficient using the covariance and standard deviation results obtained

AN ILLUSTRATION:

Assume we have the following data series for 2 variables of interest: (1) An Equity Index  (2) Stock XYZ.  They represent each variable’s return (%) for a 6 month period. Sample size (n) = 6.


Equity Index (%)

Stock XYZ (%)
   (%)   (%)
Month 1

1.8

1.25

Month 2

2.2

2.65

Month 3

0.8

1.36

Month 4

-1.5

-4.35

Month 5

1.5

2.5

Month 6

1.75

2.1


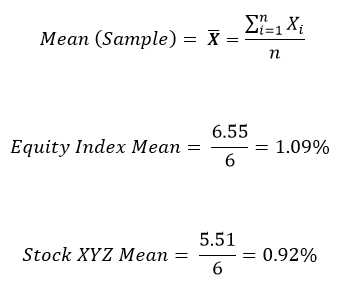
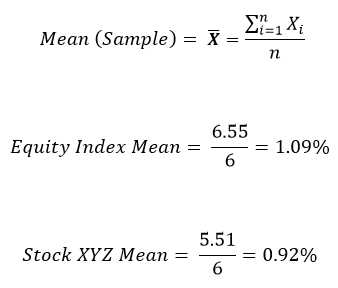
STEP 1: CALCULATE THE MEAN OR AVERAGE OF EACH DATA SERIES

Calculate Mean Step 1 Calculate Mean

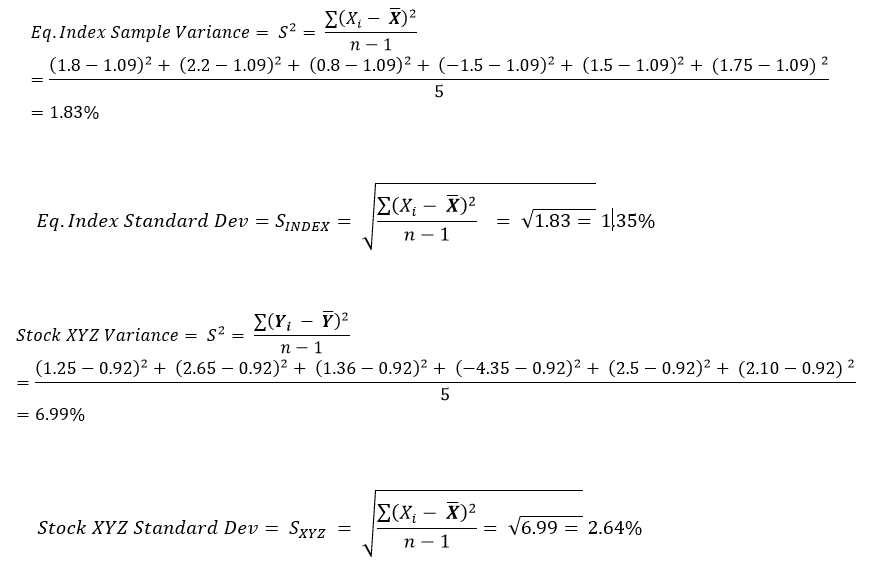
STEP 2: CALCULATE VARIANCE AND STANDARD DEVIATION FOR EACH VARIABLE

Note: Since we are dealing with a sample, the denominator in the formula below is (n-1) rather than (n)

Calculate Variance and Standard Deviation

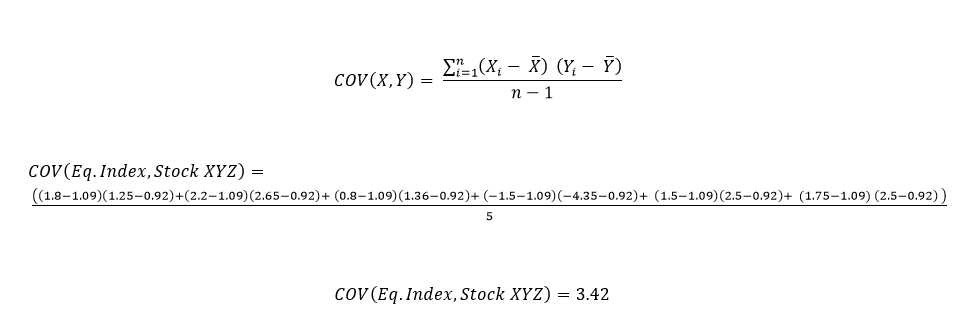
STEP 3: DETERMINE THE COVARIANCE BETWEEN THE TWO SERIES

Covariance

STEP 4: CALCULATE THE CORRELATION COEFFICIENT

The correlation coefficient between the stock index and stock XYZ can be found by dividing the covariance by the product of the standard deviations of the index and stock XYZ. The formula is:

Correlation Coefficient

LIMITATIONS OF CORRELATION ANALYSIS

Interpretation of correlation results can be misleading in certain cases. Some of the limitations include:

  • Certain functions or non-linear associations between independent variables could yield low correlation figures when in fact, the relationship between the variables exhibits a strong relationship. This disadvantage stems from the fact that correlation is a linear approximation of the association between variables


  • Correlations can be highly sensitive to outliers that are present in the data of variables. For example, for a set of observations with outliers, excluding such anomalous data could make a significant impact on the correlation coefficient. Of course, this also introduces another challenge. Does it make sense to include such outliers or not? Perhaps they contain relevant information.


  • Correlations could also suggest a relationship between variables, even when none actually exist. This could be attributed for example to mere luck. Another possible explanation is the interaction of the two variables with a third variable.


CONCLUSION

Correlation is a measure of the strength of linear association between 2 or more variables. The returns of two highly correlated stocks for example, tend to strongly move in the same direction.

The use of correlation analysis extends to numerous important fields. For example, in finance, correlation analysis can be used to measure the degree of linear relationships between interest rates and stock returns, money supply and inflation, stock and bond returns, and exchange rates.

Some of its short-comings include its unreliability, sensitivity to outliers, and the suggestion of linear relationships where none exist.

As such, its interpretation should be viewed cautiously as investment decisions made on biased correlation analysis can lead to (and it has) costly financial decisions.

What is Comprehensive Insurance?

Comprehensive InsuranceRefers to a form of insurance policy which includes a broad range of coverage or protection.

Individuals and companies seek insurance as a form of protection against potential losses. Comprehensive insurance serves to

  • Protect against unexpected and uncontrollable events
  • Provide financial compensation for economic losses resulting from such events
  • Ensure that worker’s get compensated in the event of illness or injury
  • Protect certain assets or property against damage


Types of Comprehensive Insurance

Various types of insurance products exist within comprehensive insurance plans. They include

  • Corporate insurance plans
    • Most companies provide insurance packages to their employees that include health, life, disability, etc
  • Vehicle or automobile insurance
    • Protects the policy holder against losses incurred involving their automobile
    • Can cover damage, theft, collisions, bodily injuries or rehabilitation expenses
  • Employee and Labor-related insurance
    • Insurance plans that cover an employee’s salary or wages in the event of illness, injury or other adverse work-related factors
  • Health Insurance
    • Covers the costs or expenses related to medical treatments or procedures
    • Covers physician charges
  • Life Insurance
    • Insurance that provides monetary coverage to assigned beneficiaries in the event that that the insurance holder becomes deceased
  • Home Insurance
    • Insurance coverage regarding home property, assets, or valuables against loss, damage, or theft
  • Disability Insurance
    • Coverage that is provided when an insurance holder experiences some form of disability or injury


Features of Insurance

Features include

  • Insurance coverage and plans typically have a specific  amount that is insurable
    • This is the coverage amount, and there is a maximum limit that can be paid to the insurance claimant when a defined event is triggered.
  • Premiums
    • An insurance or policy holder is typically responsible for making periodic payments to the provider of insurance coverage
    • The premiums will depend on the type of insurance sought, as well as a host of other specific factors related to the individual
  • The amount of insurance premiums depends on the size of the coverage amount
    • Insurance premiums are the payments that an insurance holder must pay to the insurance company in return for protection
    • Insurance holders can increase or decrease the amount of coverage they have
    • A high insurable or coverage amount is usually associated with higher premiums
  • Insurance plans define specific events that trigger coverage payments
    • Within each insurance policy, the insurance company will specifically define the events or factors that qualify the policy holder to claim coverage


Advantages

Insurance has many advantages including

  • The protection against negative unforeseen events that cause financial loss
  • The protection of assets and property against damage, theft, or loss
  • Insurance can safeguard an employee’s income, providing needed assistance when incapable of working
  • Comprehensive insurance products are cost-effective since they bundle several forms of insurance into one package


Conclusion

Comprehensive insurance is a packaged insurance plan including various policy plans aimed at protecting individual(s) against unanticipated negative events and associated economic losses. Insurance plans can come in various forms covering health, auto, life, disability, and employment. An insurance plan typically will have a specified coverage amount for which periodic premium payments are made towards. Under certain qualifying events, the policy holder is entitled to the coverage


Key Words: Insurance Plan, Insurance Policy, Insurance Claims, Insurance Holders,  Insurance Package, Insurance Coverage, Insurance Protection, Unexpected loss, Adverse Loss

The options collar strategy is designed to limit the downside risk of a held underlying security.

It can be performed by holding a long position in a security, while simultaneously going long a Put and shorting a Call.


STRATEGY

If an investor is concerned about a large drop in the price of a stock position, he or she can pursue a collar to place a limit to its possible losses. This strategy is used when, for example, the underlying security is experiencing heavy volatility with a bearish expectation regarding its price movement. While putting a floor on losses, a collar also caps up-side profit potential.

Constructing a collar strategy can be done by holding the underlying, purchasing an out-of-the-money put, and selling an out-of-the-money call. Both options contracts must expire on the same date.


PROFIT/LOSS DEPICTION

The graph below shows the loss and profit from a collar. It plots the profit and loss as a function of price in the underlying security.

Collar Option Strategy

PROFIT/LOSS EXAMPLE

You own 50 shares of Stock XYZ, which is currently trading at $60. You are bearish regarding its stock performance, and wish to limit your losses with the use of a collar strategy. You perform the following transactions:

ð  Long a put with a strike price of $50, cost of $150,  and a 1 month expiration (out of money) 

ð  Short a call with a strike price of $70, a premium of $250, and a 1 month expiration (out of money)

Scenario 1: XYZ is trading at $60 at expiration

Outcomes:

ð  You gain $0 from your stock position

ð  Your long put and short call expire worthless

ð  Your profit is the premium gain minus the option cost

COLLAR PROFIT:

Collar Profit = Call Premium received – Put Option Cost  

=  $250 – $150  =   $100

Scenario 2: XYZ is trading at $75 at expiration

Outcomes:

ð  You gain $250 from your stock position

ð  You lose $250 on the short call. For a short call position, a stock price higher than the strike price will yield a loss.

ð  Your long put option is worthless. For a long put position, a stock price higher than strike price makes it worthless.

COLLAR PROFIT:

Gain on Stock Position =   (Ending Stock Price – Beginning Stock Price) X Number of shares held

= ($75 – $60) X 50 shares = $750


Value of Short Call =  – (Stock Price – Ending Strike Price) X Number of shares held

=  – ($75-$70) X 50 shares = $-250


Collar Profit = Call Premium received – Put Option Cost + Gain on Stock XYZ + Value of Call Option

=  $250 – $150  + $750 –  $250   =   $600


This also happens to be the maximum profit possible from this collar strategy.

Scenario 3: XYZ is trading at 45 at expiration

Outcomes:

ð  You lose $750 from your stock position

ð  You gain $250 on the long put. For a long put position, a stock price lower than the strike price will yield a gain

ð  Your short call option is worthless. For a call position, a stock price lower than strike price makes it worthless.


COLLAR LOSS:

Gain on Stock Position =   ( Ending Stock Price – Beginning Stock Price) X Number of shares held

=  ($45 – $60) X 50 shares = – $750


Value of LongPut  = (Strike Price – Ending Stock Price) X Number of shares held

=  ($50 – $45) X 50 shares =  $250


Collar Profit =  Call Premium received – Put Option Cost  –  Loss on Stock XYZ + Value of Put Option

Collar Profit =  $250 – $150  – $750 + $250   =  – $400

This also happens to be the maximum loss possible from this collar strategy.

CONCLUSION

A collar can be an effective options strategy that is used to place a limit on losses of a volatile stock that is expected to drop in value. By holding the stock, purchasing an out-of-the-money put, and writing an out-of-the-money call, a trader can basically place a lower limit on his losses. Doing so however, also caps the potential profit possible. It is therefore typically used with a bearish sentiment regarding a stock.


The Chicago Mercantile Exchange (CME Group) is a publicly-traded derivatives-based exchange (NasdaqGS: CME) founded in 1848, and based in the United States.

Being the first exchange to introduce forward contracts, standardization in futures trading, and the clearinghouse mechanism, the exchange has evolved into an important risk-management facilitator for a diverse set of participants trading in a wide range of asset classes.

Originally a non-profit organization at inception, the CME Group (formerly known as just the CME) eventually went public on in December 2002.

A merger with the Chicago Board of Trade (CBOT) took effect in July 2007 to form The CME Group.

On August 18th 2008, a subsequent merger was formally approved between CME Group and the New York Mercantile Exchange (NYMEX).  The current Chief Executive Officer (CEO) is Craig S. Donohue.

The CME Group provides forwards, futures, and options contracts on products and financial instruments across key asset classes such as Agriculture, Energy, Metals, Equity, Treasuries and Interest Rates, Exchange Rates, Real Estate, and even the weather.

Currently, the CME Group is the largest futures exchange in the world in terms of number of contracts outstanding (or open interest).

FUNCTIONS AND ROLE

The CME Group plays a significant role in supporting efficient markets in several key products and serving the risk-management needs for investors and corporations. Some of its main functions, roles, and uses include:

  • Standardizing the trading  in derivatives contracts
  • Allowing price discovery and providing liquidity
  • Permitting hedging (and speculation) against price fluctuations in key assets
  • Acting as a clearinghouse for derivatives transactions
  • Providing diversification and risk-management tools

TRADING PROCESS

There are two principal methods of trading on the CME exchange: Open Outcry and Electronic Trading (CME Globex)

OPEN OUTCRY

The open outcry method of trading involves verbal and non-verbal communication on a physical trading venue called the trading floor (or the pit).  Typically, traders and brokers use shouting and using hand signals to communicate buying/selling intentions or motivations.

CME GLOBEX TRADING PLATFORM

Electronic trading is the backbone of over 70% of transactions conducted on the exchange.

The CME Globex platform allows traders across the globe to access thousands of futures and options contracts on a virtually 24-hour basis.

Faster, more efficient, and less costly than open outcry, CME Globex offers real-time data, high speed, and high-volume capacity trading.

The CME is an electronic order-driven market (basically an auction market).

In such a system, trading rules are set in such a way where buyers enter orders seeking the lowest price, while sellers enter orders seeking the highest price.

This price-discovery process is made possible by an electronic order-matching system that follows certain trading rules.

Such rules play an important role in providing liquidity and ensuring an orderly price-setting mechanism that is conducive to efficient markets.


TYPES OF SECURITIES TRADED

The following table presents some of the most popular and heavily traded contracts covering some major asset classes. Trading is executed amongst the CME Group merged members (CME, CBOT, NYME).

AGRICULTURE ENERGY EQUITY BONDS/INTEREST RATES FX
Grains& Oil Seeds Crude Oil US Index Fut and Options STIR G-10
Corn CL Light Sweet Crude Oil E-mini S&P 500 (Dollar) Eurodollar AUD/USD
Wheat CVF Crude Oil Volatility Ind E-mini S&P 500 (Euro) OPTMid-Curve AUD/CAD
Soybeans Oil (WTI) Financial E-mini S&P MidCap 400 1-month Eurodollar AUD/JPY
Palm Oil BZ Brent Crude Oil E-mini S&P SmallCap 600 Euroyen TIBOR AUD/NZD
Livestock Ethanol E-mini NASDAQ-100 3-Month OIS CAD/USD
Live Cattle EH Ethanol S&P 500/Value Eurodollar Calendar Spread CAD/JPY
Lean Hogs Natural Gas S&P 500/Growth US Treas. Fut and Options CHF/USD
Feeder Cattle NG Natural Gas Technology SPCTR 13-week T-bill CHF/JPY
Dairy Henry Hub Natural Gas Intl Index Fut and Options Ultra T-Bond FUT EUR/CAD
Class II Milk Electricity E-mini MSCI EAFE 2-Year U.S. Treasury Note EUR/USD
Dry Whey PJM Western Hub Peak Nikkei 225 (Yen) 3-Year U.S. Treasury Note EUR/AUD
Powder U6 ISO New England Term FTSE/Xinhua China 25 5-Year U.S. Treasury Note EUR/GBP
Softs Refined Products E-mini MSCI Emerging Markets 10-Year U.S. Treasury Note Emerging Mkts
Cocoa Heating Oil ETF Futures Interest Rate Indexes BRL/USD
Coffee RBOB Gasonline S&P Depository Receipts U.S. Aggregate Bond Index MXN/USD
Forest 7f European Gasoline PowerShares QQQ Eurozone HICP Futures ZAR/USD
Lumber Coal TRAKRS Swaps RUB/USD
Pulp Central Appalachian Coal TRAKRS PIMCO CRR DJ CBOT Treasury Index RMB/USD


CLEARINGHOUSE MECHANISM

The CME also provides an important risk mitigation function with respect to its clearinghouse mechanism, basically providing clearing and settlement for derivative transactions.

By imposing margin requirements on the counterparties (buyers and sellers) of derivates transactions, credit and default risk is minimized.

Through a marking-to-market process, gains and losses arising from positions taken in contracts are settled on a daily basis, with margin requirements adjusted accordingly.

A hypothetical example will illustrate this procedure. The numbers are purely arbitrary and do not represent actual contract prices or margin requirements:

  • A futures contract is purchased (long position) for a total value of $5,000.
  • In order to trade the contract, the CME could for example set up the following parameters:


(1)   an initial margin of $4,000

(2)   a maintenance margin of $3,000


  • If the value of the contract falls below $3,000, the trader will have to deposit money into his account to bring his margin back to $4,000.
  • Furthermore, all daily gains/losses arising from price fluctuations are settled daily in the account.


REGULATION

All derivative transactions on the CME are regulated and supervised by the Commodity Futures Trading Commission (CFTC), which was created in 1974 by the US Congress as part of its amendment to the Commodity Exchange Act (1936).

Its main mission is the protection of investors and the public from fraudulent and manipulative trading practices, and to promote sound futures and options markets

In 1982, the futures industry created the National Futures Association (NFA), with the aim of being an independent self-regulatory organization.


CONCLUSION

The CME Group is an order-driven exchange that facilitates the trading of forward, futures, and options contracts on numerous products within key asset classes such as agriculture, energy, metals, equities, interest rates, and exchange rates.

It also plays a key clearinghouse role in margining and marking-to-market transactions, effectively mitigating the credit and default risk of counterparties involved in trading derivatives.

Over the years of its existence, it has largely moved from a purely open-outcry physical trading facility into an electronically-based trading exchange.


Keywords: CBOT, Options, Futures, Derivatives Exchange, Clearing-House, Margin,


Interior of Chicago Board of TradeThe Chicago Board of Trade (CBOT) is a publicly-traded exchange (NYSE: BOT) that specializes in futures and options trading.
It was originally founded in 1848 as a non-profit marketplace for commodities, particularly agricultural products such as wheat, corn, and soybeans.

Arising into existence to allay the concerns of US merchants seeking to shield their commodities from volatile price fluctuation, the CBOT provided a centralized avenue for traders to enter into formalized contracts (forwards and futures).

By acting as a clearinghouse, the CBOT also mitigates the credit and default risk of counterparties engaged in transactions.

In July 2007, a merger between the CBOT and the Chicago Mercantile Exchange took place, creating the CME Group.

In August 2008, the New York Mercantile Exchange became part of the CME Group, and the 3 exchanges became Designated Contract Makers (DCM) of the CME Group.

Currently, the CBOT offers hundreds of options and futures on different products.

It is highly active in markets such as agriculture, energy, equities, and US Treasuries, providing an important risk-management function for thousands of its CBOT members.


Users and Purposes of CBOT

As one of the main derivative exchanges in the world, the CBOT serves important purposes for a wide variety of market participants including:

  • Investors and portfolio managers
  • Brokers and dealers, financial
  • Non-financial companies
  • Hedge funds
  • Government entities


Its main functions, roles, and uses include:

  • Being an orderly and efficient exchange enabling price discovery and liquidity in important products
  • Creating the standardization of derivative contracts
  • Mitigating exposure to price fluctuations in key assets (particularly volatile ones)
  • Acting as a clearinghouse
  • Serves diversification and risk-management needs
  • Allows certain investors such as hedge funds to construct non-conventional investment strategies
  • Permits certain investors to take speculative positions


Trading

THE PIT

The Pit is the physical trading platform where CBOT traders conduct transactions using the open outcry method of trading. Traders and brokers use shouting and certain hand signals to indicate buy or sell intentions. This method of trading has been to a large extent replaced by electronic trading systems.

ELECTRONIC TRADING

With the advent innovation and advancement in technology and software, financial exchanges sought to transition from the open outcry form of trading to faster, more efficient, and less costly electronic platforms. With simple front-end and network connectivity requirements, the CME Globex trading system allows traders from across the globe to access thousands of futures and options contracts on a virtually 24-hour basis, while offering real-time data, high speed, and high-volume capacity trading. This system plays an important role in providing liquidity to the derivative products in key markets. Based on trading rules, orders are entered electronically in an order book, and buy and sell orders are subsequently matched, thus ensuring a proper price-discovery and setting mechanism.


Types of Contracts Traded

The following table presents some of the most popular and heavily traded contracts covering the major asset classes: Trading is executed amongst the CME Group merged members (CME, CBOT, NYME).

AGRICULTURE ENERGY EQUITY BONDS/INTEREST RATES FX
Grains& Oil Seeds Crude Oil US Index Fut and Options STIR G-10
Corn CL Light Sweet Crude Oil E-mini S&P 500 (Dollar) Eurodollar AUD/USD
Wheat CVF Crude Oil Volatility Ind E-mini S&P 500 (Euro) OPTMid-Curve AUD/CAD
Soybeans Oil (WTI) Financial E-mini S&P MidCap 400 1-month Eurodollar AUD/JPY
Palm Oil BZ Brent Crude Oil E-mini S&P SmallCap 600 Euroyen TIBOR AUD/NZD
Livestock Ethanol E-mini NASDAQ-100 3-Month OIS CAD/USD
Live Cattle EH Ethanol S&P 500/Value Eurodollar Calendar Spread CAD/JPY
Lean Hogs Natural Gas S&P 500/Growth US Treas. Fut and Options CHF/USD
Feeder Cattle NG Natural Gas Technology SPCTR 13-week T-bill CHF/JPY
Dairy Henry Hub Natural Gas Intl Index Fut and Options Ultra T-Bond FUT EUR/CAD
Class II Milk Electricity E-mini MSCI EAFE 2-Year U.S. Treasury Note EUR/USD
Dry Whey PJM Western Hub Peak Nikkei 225 (Yen) 3-Year U.S. Treasury Note EUR/AUD
Powder U6 ISO New England Term FTSE/Xinhua China 25 5-Year U.S. Treasury Note EUR/GBP
Softs Refined Products E-mini MSCI Emerging Markets 10-Year U.S. Treasury Note Emerging Mkts
Cocoa Heating Oil ETF Futures Interest Rate Indexes BRL/USD
Coffee RBOB Gasonline S&P Depository Receipts U.S. Aggregate Bond Index MXN/USD
Forest 7f European Gasoline PowerShares QQQ Eurozone HICP Futures ZAR/USD
Lumber Coal TRAKRS Swaps RUB/USD
Pulp Central Appalachian Coal TRAKRS PIMCO CRR DJ CBOT Treasury Index RMB/USD


Clearing House Mechanism

As a clearinghouse for the derivative transactions conducted on the exchange, the CBOT acts as an intermediary to the counterparties involved. By enforcing margin requirements and the mark-to-market of daily profits and losses, the exchange significantly reduces the credit and default risk of the counterparties in a transaction. Along with the standardization of contracts, this clearinghouse function enhances market efficiency and liquidity while minimizing its risks.

For example, if a trader wishes to enter into a long futures contract, he/she must deposit an initial margin. This margin account is debited and credited on a daily basis depending on the price fluctuations in the underlying asset. Should the total value of the futures contract fall below what is referred to as the maintenance margin, the trader is responsible for depositing funds so as to bring it back up to the initial margin level.

Regulation

Derivative transactions on the CBOT trade in accordance with regulations mandated by the Commodity Futures Trading Commission (CFTC).

In 1982, National Futures Association (NFA) was formed with the aim of being an independent self-regulatory watch-dog organization.

Conclusion

The CBOT is an exchange providing trading in derivatives contracts and clearinghouse functions. It allows traders to buy and sell contracts on several products in asset classes such as agriculture, energy, metals, equities, bonds, and exchange rates. The majority of its trades are conducted electronically.

One metric that companies use to assess effective cash flow management is the cash conversion cycle (CCC).

The Cash flow of a company can be analogous to its life bloodline. Efficient cash flow generation and management are critical to the success of an enterprise in conducting its daily operations, pursuing investing opportunities, and meeting financial obligations.

Poor management of cash flow can lead to inability to meet payments, increasing the probability of financial distress and bankruptcy.

Cash Conversion Cycle is defined as the length of time (in days) needed to transform inventory purchases into actual cash receipts. It takes into consideration the company’s time commitment towards collecting receivables and paying its suppliers, and is an important measure of a company’s internal liquidity.

The CCC can be calculated as the sum of the inventory conversion period, receivables conversion period, and the payables conversion period.


CALCULATION STEPS

Firms typically follow a working capital cycle, whereby the acquisition of inventory is stored for a certain period of time, and subsequently sold, thus converting such purchases into sales and ultimately cash. This is precisely what the cash conversion cycle represents.

Formulaically,

Days in Inventory Outstanding (DIO) + Days in Sales Outstanding (DSO) – Daysin Payales Outstanding = Cash Conversion Cycle

Calculating the CCC can be done in 4 steps, and requires information from the 3 main working capital accounts: Inventory, Accounts Receivable, and Accounts Payable. Note that certain income statement items are needed as well.

Assume the following:

Net Revenue

$40,000

Inventory

$1,000.00

Cost of Goods Sold

$25,000.00

Average Receivables

$850

Average Payables

$2,500

Cycle Period (Days)

365


STEP 1: DETERMINE THE DAYS IN INVENTORY OUTSTANDING (DIO)

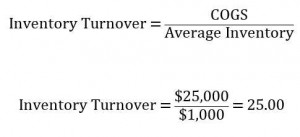
First we calculate the Inventory Turnover – defined as the number of times inventory is sold in a year:

Inventory Turnover


Then calculate the Inventory Conversion Period, which is the average time it takes a firm to convert inventory purchases into sales:

Inventory conversion Period


STEP 2: DETERMINE THE DAYS IN SALES OUTSTANDING (OR DSO)

First find the Receivables Turnover – the average number of times that receivables are turned over (or collected):

Receivables Turnover


Then find the Receivables Conversion Period (DSO), which measures the average time it takes to convert receivables into actual cash receipts.

Days in Sales Outstanding


STEP 3: DETERMINE THE DAYS IN PAYABLE OUTSTANDING (DPO)

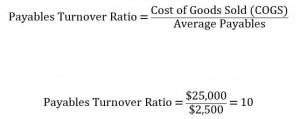
Calculate the Payables Turnover Ratio,

Payables Turnover Ratio


Followed by the payables conversion period

Paybles Conversion Period


STEP 4: CALCULATE THE CASH CONVERSION CYCLE ( CCC)

The final step is to sum up the resulting inventory, receivables, and payables conversion periods, calculated above:

Cash Conversion Cycle

Alternatively, we can express the above relationship using the turnover ratios we determined:

Turnover Ratio


It takes on average approximately 60 days for the company to inventory purchase, pay its suppliers, collect its receivables, and receive the cash


INTERPRETATION AND ANALYSIS

A low CCC is conducive to healthy working capital levels, profitability, liquidity, cash flows, and stable operating cycles.

From the example above, it takes approximately 60 days to convert inventory purchases into actual cash receipts. Needless to say, a short cash conversion cycle is desirable, and generally promotes healthy working capital levels and liquidity, cash flows, profitability, and stable operating cycles.

Understanding a company’s cash conversion cycle requires an examination of its 3 working capital accounts: accounts receivable, inventory, and accounts payable.  Managing the CCC involves managing the receivables, inventory, and payables functions.

Accounts Receivable

While an increase in receivables generates an increase in sales, holding receivables for a long time also ties up cash (since cash is received only when receivables are actually paid. Therefore, companies have an incentive to reduce the length of time that their receivables are outstanding. We can see this from the example of the equations above. Lower (or decreasing) outstanding receivables increase the receivables turnover ratio, which translates in a faster receivables conversion period (or a lower DSO). This in turn translates into a lower CCC.

Inventory

The same relationship applies to inventory. Decreasing the amount of time that inventories are held increases the inventory turnover ratio, which in turn decreases the inventory conversion period (or DIO). The effect is a lowering of the cash conversion cycle, an advantageous outcome.

Accounts Payable

The above causal relationships are reversed when dealing with payables. Companies have an incentive to lengthen the amount of time it takes to pay down payables, since that frees up and provides cash now.  Paying down payables requires the usage of cash, while an increase in payables from one period to the next increases cash.  From above, we see that higher average payables would lower the payables turnover ratio, and increases the payables conversion period (or DPO). Since the DPO is a negative component in the CCC equation, a higher DPO translates into a lower CCC – which is good.


CONCLUSION

Measuring the cash conversion cycle is important to liquidity, working capital, and the operating cycle of a company. Good management of the CCC can also enhance a company’s cash flows, allowing it to effectively make sound investing and financing decision. Managing the CCC entails efficient inventory, receivables, and payables functions, and should be part of a company’s overall operational strategy.

Keywords: Inventory Management, Fundamental Analysis, Accounts Payable, Accounts Recievable

Capital FundingCapital funding are monetary resources provided to another party for business (or non-business) purposes.

Capital funding is typically invested by a party or parties with the expectation of some form of monetary gain or return at some future time.  Capital funding plays an important resource allocation function, as its productive use plays a critical role in promoting economic growth

Who uses Capital?

Capital is provided to and used by a multitude of individuals, organizations, and businesses such as

  • Governments
    • Federal, state, or municipal governments are major recipients of capital
  • Non-Governmental Organizations
  • Corporations such
  • Private Companies
  • Start-up Businesses and Entrepreneurship Ventures
  • Charities, Foundations, and Endowments
  • Individuals

What is Capital Funding used for?

Some common uses of capital funding include

  • Capital can be used for investing purposes. For example, businesses use capital to
    • Buy land
    • Purchase equipment and fixed assets
    • Make expenditures related to their projects or activities
    • Invest resources in international markets
    • Pay their expenses and costs
  • Real estate investment and development
    • Capital can be used to purchase or develop property such as
      • Land
      • Commercial property
      • Office Towers
      • Buildings
  • Investing in financial securities by institutions, investors, and general public
    • Capital is used to
      • Purchase stocks, bonds, derivatives, or other financial securities
  • Lending purposes
    • Capital can be lent to individuals or entities with the expectation of being repaid the principal along with interest
  • Starting a business or venture
    • Capital funding is provided to entrepreneurs seeking to start a new company, and who may lack sufficient funds to do so
    • Can also be used to expand a small business and provide it with necessary resources to take it to the next level
  • Supporting charity work or good causes
    • Various charities and foundations use capital to
      • Help developing countries with urgent and humanitarian needs
      • Support those who are in need dire situations and are in need of resources
      • Create funds to treat or find cures for various diseases, illnesses, and conditions
  • Capital Preservation Purposes
    • Capital can also be preserved and gradually grown by placing it in safe interest-bearing accounts

Types of Capital Funding

Two important types of capital are equity and debt

  • Equity Capital
    • Represents an ownership stake by the capital provider
      • E.g., by providing a certain amount, an investor can own a percentage of a business
    • Common types of equity capital include
      • Common equity
        • Represent the investment in a company’s shares or stocks
        • Traded on secondary markets such as stock exchanges
      • Preferred Equity
        • An ownership stake whereby a periodic fixed percentage of return is demanded by investors
        • Possess features and characteristics of both equity and debt capital
      • Private or Venture Capital Equity
        • Equity Capital whose terms and characteristics are set uniquely and privately by the providers and users of the capital
        • Venture capital represents funds for start-up ventures and businesses,, projects, or activities
    • Usually the riskiest form of capital
      • E.g., investing in the shares of a public corporation entails the risk of losing the entire capital provided
    • Investors require a return on equity capital that is commensurate with the risk of equity capital
  • Debt Capital
    • Represents lending of capital
    • Characteristics and features include
      • a principal amount (lent amount) that must be repaid at a future date
      • Interest is applied to borrowed obligation that must be repaid periodically
      • A time horizon representing the specified time by which the borrower must repay the full obligation
      • Sometimes include the use of collateral and covenants, which are assets or funds provided as backup or reserves to protect against borrower default or non-payment
    • Some Types of Debt Capital
      • Senior Debt
        • Holders of senior debt are guaranteed to be repaid first in line, should a borrowing party default or in the event of bankruptcy
        • Will have strict collateral and covenant requirements
        • Usually command a lower interest rate than junior debt due to perceived safety of capital
      • Junior Debt
        • In the event of default of bankruptcy, holders of junior debt are paid only after senior debt holders’ obligations are satisfied first
        • Considered riskier than senior debt, and thus will usually entail a higher interest rate
      • Junk or high-yield debt
        • Debt capital that is highly speculative in terms of its probability of being repaid
        • For example, recipients of junk or high yield debt (such as companies) could be in highly precarious financial situations (such as facing or emerging from bankruptcy)
        • Considered the riskiest type of debt capital and thus a high interest rate will be applied


Conclusion

Capital funding is the provision of monetary resources or capital for productive uses. Capital provided by investors or other parties is used by various entities such as governments, companies, organizations, and individuals in order to fund their functions and operations. In most cases, capital provided is compensated by some form of return to the provider. Two important types of capital are equity and debt. Equity capital represents an ownership stake, while debt capital is a form of lending.


Key Words: Capital, Funding, Monetary, Resources, Business, Investing, Investors, Governments, Corporations, Private, Companies, Charities, Startup, Ventures, Charities, Foundations, Endowments, Return, Land, Equipment, Fixed Assets, Operations, Funding, Financing, Expenditures, Real Estate, Financial, Securities, Stocks, Bonds, Derivatives, Lending, Borrowing, Entrepreneurship, Common, Preferred, Equity, Holders, Stock, Shares, Debt, Principal, Interest, Senior, Junior, Junk, High, Yield, Secondary, Market, Exchanges,

Account Payables Management refers to the set of policies, procedures, and practices employed by a company with respect to managing its trade credit purchases.

In summary, they consist of seeking trade credit lines, acquiring favorable terms of purchase, and managing the flow and timing of purchases so as to efficiently control the company’s working capital.

The account payables of a company can be found in the short-term liabilities section of its balance sheet, and they mostly consist of the short-term financings of inventory purchases, accrued expenses, and other critical short-term operations.


WHY COMPANIES FINANCE THEIR PURCHASES

Purchasing inventory, raw materials, and other goods on trade credit allows a company to defer its cash outlays, while accessing resources immediately.

When managed appropriately financing purchases can contribute to effective working capital management.

A company that employs best practices with regards to payables management can reap the benefits of stable operating cycles that provide a stable source of operating cash flows and place it in a good liquidity position with respect to its competitors.


OBTAINING TRADE CREDIT

Companies seeking trade credit must demonstrate that they meet certain criteria with respect to their creditworthiness and financial condition.

This typically entails credit analysis by the supplier.

The financial statements of the company are analyzed, paying particular attention to its working capital, short-term liquidity and short and long-term debt to gauge its ability to meet obligations.

The final product of such analysis is usually some form of a credit risk rating.


PURCHASE AND PAYMENT TERMS

The purchase and credit terms obtained will depend on the company’s risk assessment above.

Companies that are financial stable can benefit from favorable terms (e.g. lengthy repayment periods).

For example, a company might be offered a sales on credit term of 5/10 net 30 implies a 5% discount on the purchase amount if payment is made within 10 days of billing date.

If the discount is not taken, the full invoiced amount is due in 30 day.


MANAGING PAYMENTS

After entering into purchase agreements with a supplier, the company has the responsibility of fulfilling its payment obligations.

The Accounts Payable department is accountable for this function, and performs tasks such as communicating with suppliers, sending payments and reconciling bank records, as well as updating and performing related accounting entries

Managing payables also include the expense administration with respect to the company’s own employees.

Expenses such as employee travelling, meals, entertainment, and other costs related to doing business for the company are administered by the payables department and must be managed appropriately.


EVALUATING THE PERFORMANCE OF PAYABLES MANAGEMENT

Accounts payable are one of 3 main components of working capital, along with receivables and inventory.

Understanding how these 3 accounts interact among each other and the resulting effects on working capital levels, cash flow, and the operating cycle can help in managing and evaluating payables management.

An appropriate balance must be struck, whereby the advantage of deferring cash outlays using trade credit is weighted against the risk of excessive short-term credit.

It is therefore important to maintain optimal utilization of credit lines and timing of payments, and create a balance between the need for cash, working capital, and liquidity.

A number of metrics and short-term financial ratios can be used to evaluate the performance payables management.


 Payables Turnover Ratio

Management can use this ratio to measure the average number of times a company pays its suppliers in a particular period.

A higher number than the industry average indicates the company pays its suppliers at a faster rate than its competitors, and is generally conducive to short-term liquidity.


Days in Payables Outstanding (DPO)

Measuring the average length of time it takes a company to pay for its short-term purchases in a period, the DPO can be used by management to determine an optimal timing of payments for its payables.


Cash Conversion Cycle

An important measure of the length of time required to turn inventory purchases into sales, and subsequently into cash receipts.

Using the CCC, management can assess the interaction of payables with the 2 other working capital accounts: receivables and inventory, and the resulting effects on cash flow.

A low CCC is highly desirable. A company can shorten the CCC by for example, lengthening its terms of purchases.


Net Working Capital (NWC)

NWC is the difference between current assets and current liabilities. High levels are desirable for short-term liquidity.

A decreasing pattern or trend in NWC can be attributed to increasing levels of payables, and thus can serve as a warning sign of excessive short-term credit.

A negative NWC (particularly when persistent) is a red flag for a lack of liquidity or potential insolvency.


Current and Quick Ratio

Two other liquidity measures, the current ratio expresses the NWC equation above as a ratio between current assets and current liabilities. Holding all else equal, rising A/P levels will reduce both the current and quick ratio. These ratios can be used to assess the impact of increasing payables on short-term liquidity.


CONCLUSION

The Accounts payable of a company is an important working capital account. Effective payables management can enhance a company’s short-term cash flow position through the design of optimal timing of payments to suppliers.

However, important considerations should be given to excessive financing, as that has a direct impact on the credit risk of the company and its short-term liquidity.

Introduction

Insurance is protection from losing or damaging something.

It is defined as the transfer of loss risk in exchange for payment.

Basically, if we damage or lose something that was insured, the insurance will cover the cost of having it fixed or replaced.

There are two parties in an insurance transaction:

  1. Insurers: Insurance companies who take on the risk and provide coverage
  2. Insured: People who buy the insurance and make the periodic payments for the coverage

How does Insurance Work?

When a person or business signs up for insurance with an insurance company, they get a contract called the insurance policy.

This insurance policy outlines

  • What the insured needs to pay the insurer periodically
  • And what the insurer promise to pay the insured if and when the risk of loss becomes a reality.

Insurance is based primarily on two things:

  1. Premiums: The amount of money the insured keeps paying the insurer to cover their risk of loss
  2. Claims: The amount the insurer pays the insured incase the risk of loss becomes a reality.

The business model of insurance companies is to calculate risk in such a way that the Premiums received are always greater than the Claims paid out.

The higher the risk of loss becomes a reality, the higher the premiums. If the risk of loss is too high, the insurance company will not even provide the insurance.


Types of Insurance

There are many different types of insurance in the market. A few of the main ones are:

  • Auto Insurance
  • Home Insurance
  • Health Insurance
  • Life and Disability Insurance
  • Critical Life Insurance
  • Funeral Insurance
  • Property Insurance
  • Mortgage Insurance
  • Liability Insurance

Check out the calculators on each to see what you could be eligible for.


Advantages of Insurance

Depending on the type of insurance:

  • You mitigate away the risk of a big loss
  • Builds the habit of saving for a rainy day
  • You do not have to worry in the case of sickness or accident
  • Your family is taken care of in case you are no longer around
  • Contributes to the idea of Financial Freedom and peace of mind
  • You can stop the insurance coverage any time you want


Disadvantages of Insurance

Again, depending on the type of insurance:

  • You have to keep paying premiums periodically
  • If the risk of loss never materializes, your premiums are all for naught
  • The insurance company (insurer) will try to find any technicality not to pay the claims
  • If the risk is too high, you might not get insurance coverage when you most need it

Conclusion

Insurance is an effective financial tool used to protect oneself from the risk of losing something valuable.

In this day and time, you can potentially insure anything that has the risk of loss attached to it, but like any financial transaction, one has to read the fine print to ensure the claims are paid out in case of an actual loss.

Introduction

“Credit” is a Latin word meaning trust. As long as you maintain that trust, you will be bestowed with more trust. In present day Finance, that trust comes in the form of larger credit limits, and cheaper interest rates.

fix bad creditBut what happens when you break that trust? What happens if you do not pay, even the minimum amount, when you are required to pay?

Credit Reporting Agencies punish you by lowering your score so that future lenders think twice before offering you credit, and present lenders re-assess and raise your interest rates on current borrowings.

Before you know it, you can’t finance or lease a new car, you can’t get a mortgage, you can’t even get something as simple as a phone connection.

You could have bad credit for the following reasons:

  • Late payment of Credit Card Bills
  • Late payment of bills
  • Defaulting on a loan

Whatever the reasons, bad credit is not permanent, and can be reversed by following a few tips and tricks we will outline for you.


What is the Credit Score?


 Before we delve into how to improve your credit score, you have to understand what the credit score is.

The credit score is based on a set of calculations created by FICO.

The standard credit score ranges for 300 -850. The lower this score, the worse your credit is.

Here is a general break-down of the credit scores and their meaning for you:


A lower Credit Score also results in:

  • Higher Interest Rates for your payments
  • Refusal of new credit
  • In some instances, a refusal of a job


What you need to know is that the score is based on a set of factors that are weighted as follows:

You must understand the components in detail.

Payment History: looks at how good you have been with your payments. These can include:

  • Late payments,
  • Bankruptcy declaration
  • Length of time since last payments

Amount Owing: calculates how much money you owe in how many different accounts.

Credit History Length: assesses how long it has been since you have started using credit.

New Credit: searches for recent tries and occurrences of new credit being established. These can include:

  • New credit accounts opened recently
  • Number of inquiries about credit score
  • Time since new account opening or credit score inquiry

Types of Credit Used: takes stock of the different types of credit products you have like:

  • Credit Cards
  • Car Loans
  • Mortgages
  • Line of Credit

Let Do It

Now that you understand how the credit score is split up and ascertained, you are ready to do something about improving it.

By following the following steps, you can rest assured that your credit score will increase over time:


  1. Know how much you owe completely. Keep an organized record of EVERYTHING that you owe
  2. Order your credit report from Equifax or TransUnion to determine everything you have on file
  3. Check your credit report for any mistakes or discrepancies that you are not responsible for
  4. Start paying off the highest interest debt (usually the credit card) first
  5. Keep about 30% of the credit limit on your credit card every month
    1. That means that if you have a $1,000 limit, charge up to $300 on it every month
    2. Pay off the amount at the start of every billing cycle and have the outstanding amount on your file by the end of the billing cycle
    3. You want the $300 amount to show up on your credit file as it shows that you are using and paying off your credit card responsibly without maxing out your card
    4. Do not keep applying for new credit for a while as every rejection you get negatively affects your score
    5. Keep your oldest credit card active and up to date, as old is gold in terms of credit history
    6. STOP being late on your payments. This REALLY hurts your credit score


If you follow these steps, your credit score will increase guaranteed. All it takes is some patience and dedication.


Conclusion

Having a horrible credit score is like being stuck between a rock and a hard place. It is like a vicious cycle: You can’t improve your score without borrowing and you can’t borrow without improving your credit score.

That is when you have to draw the line, make a commitment and start small. Slowly but surely, your credit will increase. And when you are finally back to where you started, you will be wiser and more responsible.

You can do two things with money: Use it now, or use it later which is also known as saving it now. Using money now is extremely easy, but saving it to use later is hard. We will teach you how to save money so that you can afford your future now.

There are three main questions you need to ask yourself to effective save money:

  1. Goal: How much money will I need?
  2. Timeline: How much time do I have to reach my goal?
  3. Assets: What do I currently have?

Goal

The first question you have to ask yourself is, “What am I saving for, and how much does it cost?”

Saving is a mindset. It is like having the resolve to go to the gym, or to eat right. It requires patience, dedication, and above all a goal to drive you.

An example of a goal could be:

  • Car
  • House
  • College
  • Groceries
  • Jewelry
  • A new phone or computer
  • A number  (I want $10,000 in my savings account)

Timeline

The next question you have to ask yourself is, “How long do I have to reach my goal?”

An example of a time-line could be:

  • 1 Week
  • 7 months
  • 5 Years

Assets

The next step is to ask yourself, “What do I currently have?

Take a tally of the money you currently have that you can put towards your goal.

Examples of Assets:

  • Savings at the bank.
  • Money / Change lying around at home

Putting it all Together

You now have all three ingredients which will tell you how much money you need to save to achieve your goal.

For Example:

  • Goal: A second–hand car costing $10,000.
  • Timeline: You want it in 15 months.
  • Assets: You currently have $2,500 saved up.

Hence, you need to save $10,000 – $2,500 = $7,500 in 15 months. Or…

$7,500 / 15 = $500 / month

What can I afford?

Revenues

You have to calculate what your current income per month is which will be the main contributor to your savings.

Examples of Revenues:

  • Paychecks
  • Pension checks
  • Government checks
  • Interest income from fixed deposits

Expenses

Now you have to ask yourself, “What do I have to pay for every month?”

Examples of Expenses:

  • Rent / Mortgage Payment
  • Electricity Bill
  • Phone Bill
  • Car Lease Payment
  • Grocery Bill

Affordable Savings Goal

You now have the information which tells you how much money you can actually afford to save to meet the saving requirements.

Example of Savings Goal

  • Revenue: $2,500 / month
  • Expenses: $2,200 / month
  • Savings you can afford: $2,500 – $2,200 => $300 / month to save to meet the saving requirements.

We have already established that in order to buy a $10,000 car in 15 months with 2,500 already in savings, you would need to save $500 / month.

Instead, you can only afford $300 / month.

Hence, you are missing $500 – $300 => $200 / month

There are four main variables that you can change to make up the deficit between “how much you need” and “what you can afford”:

  • Goals
  • Timeline
  • Revenue
  • Expenses

Goals: You can re-assess the goal that you set for yourself. In this example, you can try to choose a cheaper car.

  • Ceteris Paribus (Keeping everything else the same), you can afford a (($300 X 15) + 2,500) = $7,000 car instead of a $10,000 car.

Time-line: You can revise the time-line you had in mind to buy the car.

  • For example, instead of 15 months to buy the car, it would take you (($10,000-$2,500)/$300) = 25 months, given what you can afford.

Revenue: You could supplement your income with additional income which would increase the savings you could afford.

  • If you found a job that pays $200 / month in addition to your current job, your savings goal would be met: $300 + $200 = $500 / month

Expenses: Finally, one of the simplest, and yet hardest methods to achieve your savings goal is to be more responsible with your expenses. Some ways you can reduce your expenses are:

  • Turn off the heating when you are not around to reduce electricity bills
  • Shop around for a mortgage, or car loan with a cheaper interest rate
  • Separate needs and wants when shopping
  • Bundle your services
  • Cook at home as opposed to eating out
  • Track your spending with a budgeting app

Conclusion

Saving really is as easy as 1-2-3. You just need to remember that to achieve your savings objectives you need to

1)      Calculate what you need,

2)      Estimate what you can afford,

3)      If a deficit exists, tweak the four main variables to equate 1) and 2).

WeSeed.com Closes, But WeSeed Users Welcome on the Free HowTheMarketWorks.com Stock Market Game Site as the Best Alternative

WeSeed stock market gameWeSeed.com, a stock market game for educators and their students, will officially close on August 31, 2013.
HowTheMarketWorks.com, the largest free stock market game for elementary, middle and high school students and classes, looks forward to welcoming these users to join over 225,000 individuals currently using our virtual trading platform to learn about the stock market and practice trading.

Like WeSeed.com, HowTheMarketWorks.com is a free site designed for individuals and students that want to learn about the stock market and practice trading for the first time. When you register for free on HowTheMarketWorks.com, you will receive a brokerage account with a virtual $25,000 in cash and you will be able to begin practice trading immediately. To help you get started, visit the Education Center for hundreds of articles, videos and tutorials.

Register for a free stock market practice trading account at HowTheMarketWorks.com

Teachers, professors, and registered users can also create their own private contest and challenge their students or friends. To create a private contest, just register and then follow the links to create a contest. Best of all, this site is completely free!

About WeSeed.com

WeSeed.com was a free website aimed at teaching people about the stock market. It allowed visitors to virtually invest in real stocks and also serves as a social network, allowing people to interact and discuss their opinions on different stocks and markets. The site used a proprietary WeSearch engine, which allowed users to search for the things that interest them. The search then returned stocks that might appeal to those interests. WeSeed will officially close on August 31, 2013. The best new alternative to WeSeed.com is HowTheMarketWorks.com

About Stock-Trak

Stock-Trak is the leading provider of stock market simulations, stock market games, and stock trading contests. Our family of virtual trading and stock market education sites (StockTrak.com, HowTheMarketWorks.com, Sanebull.com, NationalSMS.com, and Investing101.net) helps hundreds of thousands of students and adults each month learn how the stock markets work and become more confident in their investing decisions. Our robust virtual trading platform can also be customized to meet the needs of banks, brokerages, media companies, and other financial websites to enable them to offer their clients a virtual stock trading experience. Founded in 1990, our virtual trading platforms and websites have helped over 3,000,000 individuals learn about the markets and practice their trading skills.

Contact:

Mark Brookshire at (770) 337-7720
Web site: http://HowTheMarketWorks.com
Stock Market Game to help educators, student

McGraw-Hill and Stock-Trak, the leader in educational portfolio simulations, have joined together to offer students that purchase a McGraw-Hill college finance textbook a FREE account at Stock-Trak’s new real-time, streaming stock simulation at HowTheMarketWorks.com, used by over 200,000 students and beginning investors each year!

Buying and selling stocks is a fantastic educational experience for students not only to expose them to the stock market, but also to help them understand more about the economy, Wall Street, interest rates, dividend policy, current events, etc.

Activating your free virtual trading account, and creating your own private stock market contest, is easy and takes less than a minute.

1. At www.HowTheMarketWorks.com, professors/instructors should register for FREE and click on Create a Contest.
2. When creating a contest, professors (or students or anyone), can select the trading period dates, the initial cash balance, the commission structure and other trading parameters.
3. After the contest is created, a unique URL will be given displayed to the professor and then that link should be distributed to the students.
4. Students click on the link, and register for free!
5. Students can then start trading.
6. Professors and students can then monitor the class rankings.

Register for free, create your own contest for your class or club, and start practicing trading and learn How The Market Works!

Click here to register for HowTheMarketWorks.com

Once you have chosen your investment strategy it is time to start learning how to build a stock portfolio. Your strategies should be inline with your overall investment strategy such as whether you are day trading and the level of risk you are looking for. Although we are sticking to stocks in this article, a lot of the principles can be applied to other assets as well.

There are thousands of different way’s to choose stocks and the chosen strategy can vary widely depending on the type of strategy you wish to employ and your objectives. Since there are so many we will look at some of the more popular strategies.

Note: For most investors choosing individual stocks is not always the wisest decision and should focus more on asset allocation and diversification. On a virtual trading site, however, we have the luxury of being able trade with large of sums of money and can make trades without worrying about the losses.

Screeners

No matter what strategy you use, a stock screener is an absolute must to find what stocks you are looking for. With a screener you can easily select penny stocks, or ETF’s or find out which company has had a large increase in the few weeks.

Strategies

Random Picks

Picking a portfolio of 100 stocks randomly has been proven, on average, to beat the market. So if you don’t know where to start, you can just pick random stocks and still hope to get a decent return.

High Risk

A virtual exchange is a perfect location to practice high risk trading. To obtain a high risk portfolio, one would select penny stocks, triple leveraged ETF’s like oil 3X UWTI. Penny stocks are generally just that, stocks that cost a few pennies. High risk may be scary but it also has the potential for huge rewards.

Buy What You Know

The best way to start of with picking stocks is to pick a stock of a company you already know about. If they have reached you as a customer, chances are they have done something right. If you see a company that not many know about that is becoming more and more popular with your friends you can get the stock before anyone even knows about it and hope to get huge returns. Another reason this works is because brand image is a very important and if you know the brand, then the company has already succeeded in something that has a lot of value.

Word of Mouth

On the other hand, one should generally not buy a company because a friend has recommended the stock because he made lots of money. In general, this strategy works very poorly since by the time you have bought you have already lost the potential for making money. This means the news you received from your friend that the company is a buy is usually quite old and stale. The other reasons is that even if you know someone who works in finance and is at the very forefront of news for a certain company, you still have to trust that he has given you a good buy.

Fundamental Analysis

This process involves researching a companies “Fundamentals” to try and ascertain what the value of the stock should be. Fundamentals include their earnings reports, forecasts, competitiveness in it’s industry and many more. Finance students will often learn about the fundamental analysis in university and is how most analysts come up with a stock rating. Essentially, if the stock’s value is under the current price, it would be a buy and if the stock’s value is below it would be a sell. If the value was roughly the same as the current price, it would be a neutral position (or hold) meaning you shouldn’t sell if you already have it but it is not a buy either. Analysts generally have one field of expertise in an industry they know more in, as the industry they are in is important.

Price Earnings

One way to quickly look at stocks that could be worth purchasing is through P/E ratio or Price to Earnings. This gives an indication of how expensive a stock is with regards to it’s earning potential. A stock with a lower P/E ratio is generally more desirable than a stock with a high P/E ratio.

Technical Analysis

Using charts, patterns and a variety of other tools, technical traders try to predict what the market will do or determine the strength of a trend.

Trend following

A very old adage in the stock market is that “The Trend is Your Friend”. When in a bull market buy you can buy the SPY ETF to ride the trend until you hit a bear market and then short SPY while in a bear market. Technical analysis can be useful here as well to get a better idea of whether the market is trending upwards or downwards.

Day trading

Day traders typically use technical analysis to determine strength of a trend or predict a trend to make a profit over a few minutes to at most a day. In order to successfully day trade you will need to find stocks with higher volatility, have sufficient volume and have a low enough price to be able to invest larger quantities of money and thus be able to buy more shares.

Dividend

A lot of investors like to have reliable companies with strong dividend history. By looking for high dividend yield’s and a good history of dividends, one can get a good reliable stock that will provide income every quarter or month.

Market Cap

“Too big to Fail” is the motto of this investment strategy. With this, someone would pick companies with very high market capitalization, that is to say, a very large company. This is essentially saying that the company has done well so far, why shouldn’t it in the future. These stocks tend to be “blue-chip” stocks as well.

Contrarian

This strategy essentially does the opposite of the market sentiment. When most people are buying, you are selling and when most are selling, you are buying.

Warren Buffet

One of the greatest investors of all time uses a variety of the strategies we’ve seen above but can be summed up pretty easily. Warren Buffet essentially buys great companies at a good price. Some of the ways he chooses an investment are as follows:

  1. Competitive Advantage – A company has to have a great competitive advantage over the competition. This could be anything from a patent to economies of scale.
  2. Brand – A good brand provides a huge competitive advantage, especially for simple every day things like ketchup and toothpaste.
  3. Reasonable Price – A great company isn’t a great company if it is very expensive right now. Warren buffet has said that what a company costs is the price, but what you get is the value.
  4. Proven – A company has to have a long and stable track record of earnings before he will invest in them.

Warren Buffet’s approach is therefore close to someone using fundamental analysis but throwing out anything that isn’t a good company with a great brand.