Actually, one of the better indicators historically of how well the stock market will do is just a Gallup poll, when you ask Americans if you think it’s a good time to invest in stocks, except it goes the opposite direction of what you would expect. When the markets going up, it in fact makes it more prone toward decline.
Belgium is an EU member located in Western Europe. It has a strong industrialized economy, well-developed transportation infrastructure, and a highly productive work-force making it an attractive destination for foreign capital.
Belgium’s Main Industries
Belgium is economically known for its strength in:
Diamonds
Industrial and Manufacturing Sector
Engineering and Metal Products
Minerals Processing
Copper
Zinc
Lead
Steel and Iron Production
Heavy machinery and industrial equipment production
Motor and Vehicle Assembly and Production
Automobiles
Ships and vessels
Petroleum
Food and Beverage Processing
Chemicals and Pharmaceuticals
Sulphuric Acid
Nitric Acid
Synthetic Ammonia
Crude Tar
Textiles Processing
Cotton
Wool
Linens
Synthetic Fabrics
Spinning
Weaving
Belgium’s Main Stock Exchange
The main stock exchange in Belgium is:
1. Euronext Brussels
Founded in the early 19th century
Merged with the ParisBourse and Amsterdam Exchanges to form Euronext
Euronext provides a single, cross-border exchange for markets in equities and derivatives
Main Index
i. BEL 20 – includes twenty highly liquid Belgian equities
Belgium is an important trading partner with many EU members, and as such, many companies in the EU region have also listed on the Euronext Brussels.
Glimpse into Belgium’s Equity Market
Belgium listed equities have rebounded following the 2008 financial crisis yielding around 30% from recessionary bottoms, as represented the BEL 20 index.
The Euronext Brussels market capitalization rose 17% from Euro 202 billion (2009) to Euro 273 billion (2010).
Stock Index Performance: BEL 20 Index
Belgium’s 10 Most Profitable Companies in 2010
Ways to Invest in Belgium
There are a couple of different ways to invest in Belgian companies:
Financial or Investment firms
Brokerage services are provided by domestic or international firms in Belgium
Through a regional Belgian bank
Belgian banks offer securities investment services
AXA Bank
KBC Bank
BNP Paribas Fortis
Argenta
Belgian ETFs
EWK:NYSE ARCE – tracks the MSCI Belgium Investable Market Index
Italy is an EU member country and one of G-8 leading industrialized economies, having the seventh largest economy in the world. Its thriving small and medium enterprises play an important economic role. Italy has world-leading companies in manufacturing, automobiles, textiles, and agriculture.
Italy’s Main Industries
Italy is economically known for its strength in:
Agriculture Sector
Maize corn
Olive Oil
Fruits and Vegetables
Flowers
Wine
Meat
Dairy Products
Services
Financial
Banking
Insurance
Asset Management
Tourism
Precious metals
gold
Industrial and Manufacturing
Iron and Steel
Chemicals
Machinery
Automotives
Precision Engineering
Textiles and CLothing
Italy’s Main Stock Exchanges
The main stock exchange in Italy is:
1. Borsa Italiana
Founded in 1808 and operated under state ownership until privatisation in 1997
In 2007 was purchased by the London Stock Exchange
Serves trading in equities, and plays an important role in Italy’s fixed income and derivatives market
Some Indices
i. FTSE/MIB Index
ii. MIBTel
Glimpse into Italy’s Equity Market
Foreign equity investors have remained cautious, with investment inflows not being significant in 2010. Italy’s equities have been considerably impacted by the Euro-zone debt and default crisis, and amid an uncertain economic outlook, with the stock index down 12% during the 2010 year.
Market capitalization of stocks has been stable, increasing from $317 billion in 2009 to $318 billion in 2010.
Italy’s 10 Most Profitable Companies in 2010
Ways to Invest in Italy
There are a couple of different ways to invest in Italian companies:
Through Italian Banks or foreign ones located in Italy
Ireland is an EU member country with a knowledge-based economy and strong industries in services and technology. With attractive corporate tax rates, Ireland has been ideal destination for multinational corporations.
Ireland’s Main Industries
Ireland is economically known for its strength in:
Agriculture Sector
Cattle
Beef
Dairy
Services Sector
Financial
Banking
Asset Management
Tourism
Mining and Metals Sector
Zinc
Lead concentrates
Alumina
Coal
Gypsum
Limestone
Industrial and Manufacturing Sector
Construction Sector
Residential property
Pharmaceuticals and Chemicals
Technology Sector
Hardware
Software related goods and services
Energy Sector
Supply and distribution of natural gas
Electricity
Coal
Ireland’s Main Stock Exchanges
The main stock exchange in Ireland is:
1. Irish Stock Exchange
Founded in 1793 and is Ireland’s sole independently-owned exchange
Has an established and extensive debt securities trading market
Operates three principal markets
i. Securities of established domestic and global Irish companies
ii. Growth-oriented companies
iii. Debt market
Indices
i. ISEQ Overall Index
Glimpse into Ireland’s Equity Market
Irish equities experienced negative returns following the 2008 economic crisis. With the Irish banking sector have a heavily credit exposure to a deteriorating and crashing property market, the economy underwent significant problems.
The 3-year return on the ISEQ overall index was -48%. The index has somewhat recovered however, with the last 9 months yielding 4.5%
Ireland’s 10 Most Profitable Companies in 2010
Ways to Invest in Ireland
There are a couple of different ways to invest in Irish companies:
Irish Banks of foreign banks/investment companies in Ireland
Allied Irish Banks
Anglo Irish Bank
Bank of America
DePfa Bank
KBC Bank Ireland
Rabobank Ireland
Goldman Sachs Bank (Europe)
Irish ETFs
EIRL:NYSEArce – seeks to track the MSCI Ireland Capped Investable Market Index
EKH:NYSEArce aims to allow diversification through the performance of some of the largest European companies listed on the US market (has some exposure to Irish companies)
Hungary is an EU member country with a medium-sized, liberal economy that is rapidly developing. It has the 5th largest economy in Central and Eastern Europe, with major exports in machinery, chemicals, textiles, and agricultural products.
Hungary’s Main Industries
Hungary is economically known for its strength in:
Agriculture Sector
Wheat
Corn
Sunflower
Potato
Sugar beet
Canola
Apple
Pear
Grape
Wine
Livestock
Industrial and Manufacturing Sector
Automobile Production
Engine manufacturing and production
Vehicle Assembly
Heavy Industry
Mining and Metallurgy
Metalworking and processing
Steel Production
Metallurgy
Machine Production
Machine tools
Transport Equipment
Electrical Appliances
Energy Production
Mechanical Engineering
Chemicals
Food Processing
Services
Tourism
Hungary’s Main Stock Exchange
The main stock exchanges in Hungary is:
1. Budapest Stock Exchange
Previously The Hungarian Stock Exchange (1864)
Operates as a subsidiary of the CEESEG AG holding company, which owns around 70% of the BSE
Over 40 domestic and international brokers participate in trading on the BSE
Products traded include
i. Equities
ii. ETFs
iii. Government and corporate debt
iv. MBS
v. Futures and options
vi. Grain commodities
Important indices
i. BUX
ii. MSCI Hungary Index
Glimpse into Hungary’s Equity Market
Hungary’s economy was severely impacted by the recent recession, owing partly to having one of the largest public deficits in the EU region. However, it has recovered quite well, and its equities have rebounded solidly over the past year.
The MSCI Hungary Index stock index rose 24.36% over the last year, with a year-to-date of 16.59% return.
Stock Index Performance: BUX
Hungary’s 10 Most Profitable Companies in 2010
Ways to Invest in Hungary
There are a couple of different ways to invest in Hungarian companies:
Through a regional Hungarian Bank or a foreign bank/investment company located in Greece
Erste Bank Hungary
Budapest Hitel
OTP Bank
Deutsche Bank
BNP Paribas Hungaria Bank
Raiffeisen Bank
Investors can purchase equities through a regional bank
Hungarian ETFs
ESR:NYSEArca – tracks the MSCI Emerging Markets Eastern European Index Fund
GUR – aims to replicate the SPDR S&P Emerging Europe index, and has over 5% exposure to Hungary
Peru is a Latin American country with an emerging, market-oriented economy that has been among the top performers in South America. Rich in natural resources, it is a major exporter of gold, copper, zinc, and fish.
Peru’s Main Industries
Peru is economically known for its strength in:
Agriculture Sector
Fishing
Artichokes, grapes, avocadoes, mangoes,
Cotton
Coffee
Sugar
Services Sector
Tourism
Natural Resources
Copper
Gold
Silver
Petroleum
Timber
Iron ore
Coal
Natural gas
Mining Sector
Gold
Coal
Copper
Zinc
Silver
Iron Ore
Manufacturing and Industrial Sector
Metal mechanics
Tobacco processing
Food processing
Textile
Peru’s Main Stock Exchanges
The main stock exchange in Peru is:
1. Bolsa de Valores y Productos de Asunción (BVPASA)
Established in 1977 and is Peru’s only stock exchange
Exchange provides trading services in equities and debt securities of both public and private companies
Stock Index
i. IGBVL index
Glimpse into Peru’s Equity Market
Prior to the global financial crisis in 2008, Peru experienced economic growth that was among the top-performers in Latin America (2007 and 2008). Political stability and liberalised economic policies have made Peru a very open investment regime, attracting significant foreign investment and capital
Equities performed exceptionally well in 2009 and 2010, with the IGBVL index rising 101% and 65%, respectively. Between the same periods, the market capitalization of its exchange grew by 43% from $US 69.7 billion to $US 99.8 billion.
Peru’s 10 Most Profitable Companies in 2010
Ways to Invest in Peru
There are a couple of different ways to invest in Peruvian companies:
Through a Peruvian Bank or foreign one located in Peru
BBVA Banco Continental
Banco Financiero del Peru
Bank of Nova Scotia
JP Morgan Chase Bank
Banco Standard Chartered
Citibank
Peruvian ETFs
EPU:NYSEArca – Peruvian ETF that tracks the MSCI ALL Peru Capped Index
Portugal is an EU member country with a high-income and service-based economy. It enjoys vast forests, has a strong industrial base, and is an important agricultural exporter.
Portugal’s Main Industries
Portugal is economically known for its strength in:
Agriculture and Fishing Sector
Cereals
Olives
Wheat
Maize
Wine
Oranges
Fish
Industrial and Manufacturing Sector
Oil refining
Cement production
Machinery and electronics
Textile and footwear
Food processing
Forestry Sector
Pulp
Paper
Services Sector
Tourism
Transport
Telecommunication
Financial
Banking
Natural Resources Sector
Lithium
Tungsten
Tin
Uranium
Portugal’s Main Stock Exchanges
The two main stock exchanges in Portugal by size are:
1. Euronext Lisbon
Created in 1769 as the Lisbon Stock Exchange
Acquired in 2002 by Euronext NV to become Euronext Lisbon. It became part of the NYSE Euronext Group following their merger in 2007
Trading occurs mainly in equities, bonds, warrants, ETFs, and derivatives
Index
i. PSI-20 – composed of Portugal’s 20 largest companies by market cap and share volume
2. OPEX
An alternative trading system (ATS) geared for trading in small and medium sized Portuguese companies
Listing criteria is not very rigid and regulated
Specializes in alternative investments and securities such as
i. Warrants and certificates
ii. Derivatives
Investors include private equity investors, hedge funds, and pension funds
Glimpse into Portugal’s Equity Market
The performance of Portuguese equities has been heavily impacted by the Euro-zone peripheral economies’ debt crisis, as well as its own. The Market capitalization of its exchange fell by 17% in 2010 to $81.9 billion, and its equities have significantly underperformed during the last 3 years with a -30% return.
Investor capital and equity outflows have been considerable during this period, and investment should be limited with the current uncertain outlook. Portugal has recently negotiated a $110 billion bailout from the EU and IMF.
Ways to Invest in Portugal
There are a couple of different ways to invest in Portuguese companies:
Through a regional Portuguese Bank
Portuguese banks enable their clients to invest in securities listed on the exchange
Banco Espirito Santo
Banco Comercial Portugues (BCP)
ETFs with exposure to Portugal
CUT:NYSEArca – tracks the Beacon Global Timber Index
DFE:NYSEArca – tracks the WisdomTree Europe SmallCap Dividend Index
Romania is an EU member country, which has experienced positive foreign direct investment and GDP growth following privatization initiatives over the last decade. It has an upper-middle income economy strong in its industrial and agricultural sectors.
Romania’s Main Stock Exchanges
The two main stock exchanges in Romania by size are:
1. Bucharest Stock Exchange
It was founded in 1882 and has merged with Romania’s OTC exchange (RASDAQ) in 2005.
The principle securities traded on this exchange include:
Equities
Government and Corporate debt
Fund units
Structured products
2. SIBEX
It is Romania’s second largest exchange, and is designed for trading in derivative securities such as futures and options on
Stocks and indexes
Currencies
Interest rates
Commodities such as gold
Glimpse into Romania’s Equity Market
Romania’s major index is the BET, which is composed of Romania’s 10 largest listed companies.
Romanian equities yielded positive returns of 16% during the last year, and have performed solidly relative to other European equities.
Market cap of listed equities increased 7% from $US 30.3 billion in 2009 to $US 32.3 billion in 2010.
Stock Index Performance: BET 20
Romania’s 10 Most Profitable Companies
Ways to Invest in Romania
There are a couple of different ways to invest in Romanian companies:
1. Through a bank in Romania
Banca Tanssilvania
Romanian International Bank
CEC Bank
Alpha Bank
ABN Amro
Raiffeisen Bank
Citibank Romania
Libra Bank
2. ETFs
ESR:NYSEArce – It is an emerging markets ETF with high exposure to Eastern Europe
Austria is an EU member and currently the 12th richest country in the world. It has experienced sustained economic growth and attracts many foreign investors. Austria is home to internationally reputable law firms and banks, and has a vibrant tourism sector.
Austria’s Main Industries
Austria is economically known for its strength in:
Services Sector
Financial
Banking
Asset management
Law
Tourism
Industrial and Manufacturing Sector
Metals Production
Iron
Steel
Machinery
Electric
Electronic
Equipment
Chemicals and Petro-Chemicals
Synthetic textile fabrics
Pesticides
Pharmaceuticals
Plastics
Textiles
Embroidery
Spinning
Weaving
Knitting
Forestry Sector
Pulp
Paper
Mining and Minerals Sector
Magnesite
Lignite
Iron Ore
The main stock exchange in Austria is:
1. Vienna Stock Exchange
Austria’s principal stock exchange
Operated by the company Wiener Börse
Core trading activities are equity and bond markets
Also separately operates the Energy Exchange Austria and the CEGH Gas Exchange
Main Index
i. ATX
Glimpse into Austria’s Equity Market
Austrian equities have experienced a strong recovery following the recent recession, with the Market Capitalization of its listed companies increasing by 26% from $53.6 billion in 2009 to $67.7 billion in 2010.
In 2010, the Vienna Stock Exchange had 10 IPOs issued by domestic and foreign enterprises.
Stock Index Performance: ATX
Values:
Last
-1 Mo.
-3 Mo.
-6 Mo.
-9 Mo.
-1 Yr.
-3 Yr.
-5 Yr.
-10 Yr.
6/10/2011
5/10/2011
3/10/2011
12/10/2010
9/10/2010
6/10/2010
6/10/2008
6/12/2006
6/11/2001
Price
2,707.50
2,864.00
2,806.83
2,829.99
2,487.27
2,338.71
4,166.44
3,487.03
1,227.00
Performance:
YTD
-1 Mo.
-3 Mo.
-6 Mo.
-9 Mo.
-1 Yr.
-3 Yr.
-5 Yr.
-10 Yr.
Value Change
-24438.00
-156.50
-99.33
-122.49
220.23
368.79
-1,458.94
-779.53
1,480.50
% Change
-5.46%
-3.54%
-4.33%
8.85%
15.77%
-35.02%
-22.55%
118.72%
Source: Datastream
Austria’s 10 Most Profitable Companies in 2010
Rank
Company
Sector
Industry
Symbol/Ticker
Profit ($ mil)
Revenue ($ mil)
1
Raiffeisen Bank International AG
Banks
Financials
RBI-VI
1,458.88
12,853.72
2
OMV AG
Oil&Gas
Energy
OMV-VI
1235
31,289.03
3
Erste Group Bank AG
Banks
Financials
EBS-VI
1,172.9
15,954.51
4
Voestalpine AG
Metals&Mining
Materials
VOE-VI
727.57
15,544.3
5
Verbund AG
Electric Utilities
Utilities
VER-VI
537.68
4,437.64
6
Wiener Stadtische Versicherung AG
Insurance
Financials
VIG-VI
509.45
12,533.49
7
EVN AG
Electric Utilities
Utilities
EVN-VI
282.53
3,757.19
8
Telekom Austria AG
Diversified Telecommunications
Telecommunication Services
TKA-VI
262.07
6,239.23
9
Andritz AG
Machinery
Industrials
ANDR-VI
240.92
4,767.5
10
Strabag SE
Construction&Engineering
Industrial
STR-VI
234.58
16,610.17
Ways to Invest in Austria
There are a couple of different ways to invest in Austrian companies:
Through established foreign and domestic investment or financial firms with brokerage services
Through a regional Austrian bank
Investors can access Austrian equities through Austrian banks
Bank Austria
Ostereichische Postsparkasse (P.S.K)
Raiffeisenbanken
Austrian ETFs
EWO: NYSEArce – tracks the MSCI Austria Investable Market Index
Argentina is a South American country that is one of the G20 economies. It is the third largest economy in Latin America and has the highest GDP per capita in its region. It possesses plenty of natural resources, a strong agricultural sector, and a well-educated population.
Argentina’s Main Industries
Agriculture: beef, fruits and vegetables, wheat, cattle, tabacco
Considered an emerging economy, Argentina attracts significant foreign investors and capital.
In 2022 Foreign Direct Investment (FDI) increased in Argentina to $15 billion, (source: World Investment Report 2023). With the 3rd largest economy in Latin America, it has gained a reputation as a country with high inflation and a complex regulations. However, the government has been implementing policies to attract more foreign investment.
There are opportunities in the energy industry as Argentina has significant shale gas and oil reserves. Mining is another big industry with several major producers of copper, lithium and other minerals in the country. Buenes Aires is also emerging as a major tech center for Latin America. With many skilled workers and a lower cost of living compared to other tech hubs, new Argentinian tech startups are experiencing a competitive advantage. The government is aiming to support continued technological innovation through tax incentives in high-tech sectors.
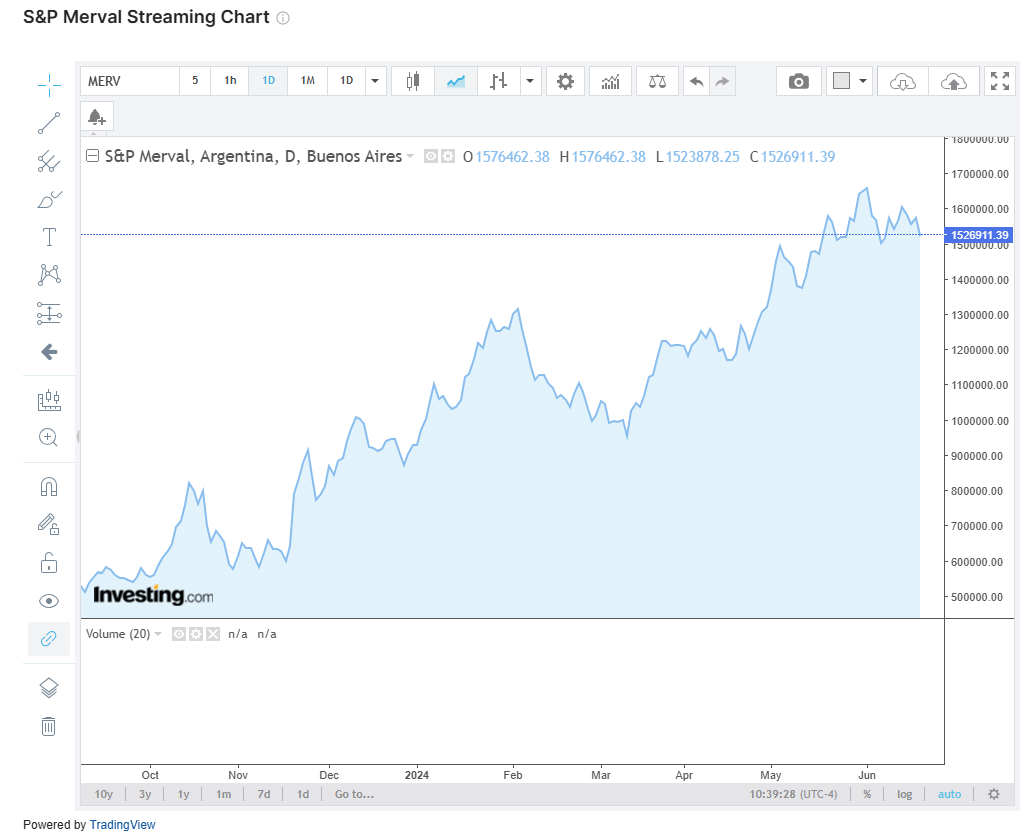
Stock Index Performance: MERVAL
The MERVAL (stock index) is a weight-adjusted fund that has been trading since 1986. It was initiated by the S&P Dow Jones Indices in 2019. MERV reached an all-time high in May 2024. Since the beginning of 2024, the index has increased 69.57%.
Consultancy A.T. Kearney does a periodic study of worldwide investments by managers at the world’s largest companies and how the economy effects those investments. In 2007 there was an all-time high investment of $1.98 trillion in 2007 by these multinational companies. Foreign direct investment worldwide fell 14% in 2008. In 2009, it fell another 39%. A.T. Kearney says that these investments have only started to increase recently. The multinationals postponed much of their planned investments due to continued market uncertainty and the problems in obtaining credit.
Recently there has been a rise of emerging markets. As you would expect, the top countries for investment include China, India, and Brazil. Poland has moved up 16 rungs to weigh in at No. 6. Other countries to enter the top 25 include: Romania, Saudi Arabia, Chile, and Egypt. For a more detailed look at the top countries for foreign investment by international executives, please visit these links:
Gross National Product is the value of all goods and services produced by a country’s residents.
GNP
Is based on the market value of goods and services
Takes only final goods and services into consideration
Relies on factors of production such as the country’s labor and capital
Is measured on an annual basis
How is GNP used?
Gross National Product statistics are used to
Measure the economic activity of a country
Evaluate and analyze economic growth
Assess how productive a country’s factors of production are
Measure the value of important goods and resources
Analyze the income earned by a country’s residents
Compare the performance of different countries
Develop economic policies aimed at improving GNP figures
How is GNP Measured?
Two approaches can be used to measure GNP: (1) The Income Approach (2) The Expenditure Approach
(1) Income Approach
Measures the income or earnings received by the country’s factors of production (Labor, Land, Capital)
GNP = Wages + Interest Income + Rental Income + Profit
GNP or National Income is the sum of
Wages
The salaries, income or earnings that residents received for their work and labor during an entire year
Interest Income
Any income earned from holding assets or funds in
Bank savings accounts
GICs
Treasury-Bills
Canada Savings Bonds
Interest earned on foreign investments
Rental Income
Any income earned from owning and renting property.
Includes income from renting
A house
Apartments
Rooms
Office space
Profit
Income earned from investments (e.g., dividends from stocks)
(2) The Expenditure Approach
Measures the amount spent or paid (expended) on all goods and services during the year at market value or prices
Uses and sums up two main components: (1) Gross Domestic Product and (2) Net Income from Abroad
We need to first calculate Gross Domestic Product (GDP)
GDP is the value of a country’s products and services produced in year
5 main components of GDP
Private Consumption and Expenditure (households) – C
Investment Expenditure – I
Government Expenditures – G
Exports – X
Imports – M
GDP = Private Consumption + Investment Expenditure + Government Expenditures + Net Exports
GDP = C + I + G + (X – M)
Next, we determine Net Income from Abroad, which is composed of
Income from Abroad – income received by citizens from overseas business activities
Income to abroad – income provided to foreign citizens from their business activities in the domestic country
Using both components, we calculate GNP as
GNP = GDP + Net Income from Abroad
Conclusion
The Gross National Product (GNP) is an economic measure of the market value of all goods and services produced by a country’s residents. It is an important and widely followed statistics that indicates the strength and growth of an economy, as well as the productive use of its factors of production such as labor and capital. It can be measured using the income or expenditure approach.
Free Cash flow is the cash available to all the capital providers of a company
There are two types of free cash flows
Free Cash Flow to the Firm (FCFF)
Cash flow available to pay out to all capital providers such as common stock holders, debt holders, and preferred stock holders.
Free Cash Flow to Equity (FCFE)
Cash flow that is available strictly to the company’s common stock holders (equity)
The FCFF and FCFE are not reported on a company’s financial statements, therefore, the analyst or investor must perform necessary calculations to arrive at these figures.
Financial Statement Items
First, we review some of the necessary financial statement items need to compute FCF
Net Income: the Earnings of the company after operating, interest, depreciation, and tax expenses have been made
Noncash charges: include items such as depreciation which do not represent an actual outflow of cash
Capital Expenditures: the company’s investments in fixed assets and capital. These are an important source of future growth for a company
Working Capital: the company’s short-term capital necessary to conduct its daily business operations. These include:
Receivables
Inventory
Payables
Cash Flow from Operations: The net amount of cash from the company’s operating activities
Interest Expenses: the company’s costs of assuming debt
Liabilities / Borrowing: The amount that the company borrows in terms of its debt obligations
FCFF and FCFE Equations
Free Cash Flow to the Firm (FCFF)
Cash available after operating expenses, working capital, and capital expenditures have been taken into consideration.
The company can use this cash flow to:
Pay its common equity holders with dividends
Pay its debt holders back (i.e., pay down its principal)
Pay its preferred equity holders
Equation:
FCFF = Net Income + Noncash items + Interest Expenses (1-Tax Rate) – Capital Expenditures – Working Capital Requirements
Free Cash Flow to Equity (FCFE)
Cash available to common equity holders after payments related to debt are made and working capital and capital expenditures are taken into account.
The payment s relating to debt include:
Payments such as interest expenses and debt principal repayment
The company can use this available cash flow to pay its common stock holders.
Equation:
FCFE = Net Income + Noncash items – Capital Expenditures – Working Capital Requirements + Net Borrowing
Why are FCFs used?
Some uses and applications of FCFs
To assess the company’s ability to pay its equity and debt capital providers
FCFs can be used when the company does not pay dividends, and as such, does not have a track record of paying equity holders. FCFs can indicate how much the firm can pay out
FCF can be used by a company to repay the principle related to its long-term debt
FCFs are used with for firm valuation purposes, such as with Discounted Cash Flow (DCF) models to measure a company’s intrinsic value
Conclusion
Free cash flows are a company’s cash available after operating expenses, capital expenditures and working capital requirements have been accounted for. It represents the funds available for the company’s capital providers. The FCFF represents cash available to both equity and debt capital providers, while the FCFE is the cash flow that can be reserved to the company’s common equity holders. FCFs play an important role in financial modeling and discounted cash flow techniques in determining valuation for an asset or financial security
The Form-8K is a SEC-mandated report filed by public companies to report unexpected events or transactions that are material in nature, and thus have an impact on the share prices of the company.
In accordance with the Securities Exchange Act (1934), specifically defined events must be reported within 4 business days. The main purposes of the Form 8-K are to:
Satisfy regulatory requirements
To provide investors and shareholders with up-to-date company information
Update previously released reports such as the 10-Q (quarterly report) and the 10-K (annual report) with important developments.
The criteria for reporting such material events or transactions are defined within 9 major sections or categories. These events (or transactions) are deemed to be significant for investors and shareholders towards their investment-decision making.
Why are Form 8-K reports important?
To make sound investing decisions, investors need information that is timely, reliable, and accurate. Material information concerning the activities, operations, and business of a corporation can have a significant impact on important aspects such as
Future revenues, earnings, cash flows, and other financial items
Strategic direction
Competitive positioning in the market
The industry it operates in
Such factors inevitably will impact its share price in the market. Therefore, it is important that investors have access to important information that is crucial in making investment decisions.
Annual reports (10-K) and quarterly reports (10-Q) contain valuable information. However, there is a time lag between the issuance dates of such reports. The Form 8-K is therefore used as a vehicle to report material events not captured by the 10-Q or 10-K.
What are material events?
The actual Form 8-K is available for download on the SEC’s website at:
Material events fall under one of 9 main sections.
Section 1- Registrant’s Business and Operations
MATERIAL EVENTS:
Entry into a material definitive agreement
Termination of a material definitive agreement
Bankruptcy or receivership
Section 2- Financial Information
MATERIAL EVENTS:
Completion of acquisition or disposition of assets
Results of operations and financial condition
Creation of a direct financial obligation or an obligation under an off-balance sheet arrangement of a registrant
Triggering events that accelerate or increase a direct financial obligation or an obligation under an off-balance sheet arrangement
Costs associated with exit or disposal activities
Material impairments
Section 3- Securities and Trading Markets
MATERIAL EVENTS:
Notice of delisting or failure to satisfy a continued listing rule or standard; Transfer of listing
Unregistered sales of equity securities
Material modification to rights of security holders
Section 4- Matters Related to Accountants and Financial Statements
MATERIAL EVENTS:
Changes in registrant’s Certifying Accountant
Non-reliance on previously issued financial statements or a related audit report or completed interim review
Section 5- Corporate Governance and Management
MATERIAL EVENTS:
Changes in control of registrant
Departure of directors or certain officers; Election of directors; Compensatory arrangements of certain officers
Amendments to articles of incorporation or bylaws;
Change in fiscal year
Temporary suspension of trading under registrant’s Employee Benefit Plans
Amendments to the registrant’s code of ethics, or waiver of a provision of the code of ethics
Changes in shell company status
Submission of matters to a vote of security holders
Section 6- Asset-Backed Securities
MATERIAL EVENTS:
Change of servicer or trustee
Change in credit enhancement or other external support
Failure to make a required distribution
Securities act updating disclosure
Section 7- Regulation FD
MATERIAL EVENTS:
Regulation-required disclosures
Section 8- Other events
MATERIAL EVENTS:
other events deemed material or having important informational value
Section 9- Financial Statements and Exhibits
MATERIAL EVENTS:
financial statements of businesses acquired
pro-forma financial information
shell company transactions
Conclusion
The Form-8K report is crucial for investors and shareholders in remaining current on major or material events and transactions performed by a company.
Such events typically have the ability to affect the firm’s stock price. Therefore, investors use such information to update their investment decisions such as buying, selling, or holding the stock.
The Form 8-K report is mandated by the SEC, with the purpose of providing timely and relevant information not included in annual or quarterly reports.
Fixed income analysis is the process of evaluating and analyzing fixed income securities for investment purposes.
Fixed Income represents a distinct asset class. Investors and analysts perform fixed-income analysis to
Evaluate the risk characteristics underlying debt securities and to assess the capacity of the borrowing entity to meet its financial obligations (credit analysis)
Identify which debt securities represent attractive investment opportunities
Determine the appropriate valuation (or value) of debt securities in the market
Compare the investment characteristics (e.g., risk and return) of debt securities with each other and with other asset classes such as stocks, derivatives, real estate, or other.
Features and Characteristics of Fixed Income
Some important features of fixed income securities include
Government versus Corporate Bonds
On a very broad level, fixed income securities can be categorized as
Government
E.g., US Treasuries
Corporate
Bonds issued by public corporations
Issuer
The party, entity, or corporation that sells the debt obligation to investors
This is the borrowing entity
Borrower or Debt Security Holder
The party that has purchased the debt obligation (i.e., the lender)
Principal or Face Value
The amount borrowed which has to be repaid in full at a future date
Interest
The interest rate that is applied to the principal borrowed amount
Periodic Payments
The periodic dates during the life of the debt for which the borrower is responsible for making regular payments of interest or principal (or both)
Maturity
The length of time from the inception of the debt to its termination
Fixed-Income Options
Options embedded within fixed income securities giving the lender or borrower the right to either redeem the obligation
Callable Bond – the issuer of the debt obligation retains he right to redeem the bond before its maturity date
Putable Bond – the holder of the debt obligation (the borrower) retains the right to redeem the bond before its maturity date
Convertibility
Convertible debt securities allow the debt security holder to convert the debt obligation into common equity
Elements of Fixed Income Analysis
The following elements are typically common when analyzing the fixed-income security of a corporation
Credit Analysis
Analysis of the company’s financial statements
Assessment of creditworthiness and capacity to pay
Analysis of collateral and covenants
Risk Analysis
Corporate fixed-income securities are exposed to certain risks, which can include one or more of the following
Interest rate risk
Inflation risk
Credit or default risk
Liquidity risk
Foreign Exchange risk
Sovereign risk
Fixed-Income Valuation
A time-value based formula and methodology is used to value fixed income securities
The bond’s interest payments and principal are discounted back to today, to arrive at a present value figure (which is the bond’s value)
The present value of each future cash flow is found and summed up
The following are needed to perform the valuation
The coupon or interest rate
The coupon or interest payments
The Face Value or Principal amount
The discount rate used to find the present value of each future cash flow
Comparison with Government Debt Securities
Fixed-income analysis also includes a comparison of the corporate debt-security’s return or yield with that of risk-free US government debts (Treasuries)
These are highly safe, liquid, and debt obligations
The return on Treasuries is seen by investors as the minimum acceptable or possible return in the market
The return on corporate fixed income securities is compared to the return on US treasuries to measure the “extra” yield/return offered (also referred to as risk premium)
This extra return is required by investors for assuming the risks inherent in corporate fixed income securities (see above for list of risks)
Conclusion
Fixed income analysis is the analytical framework used to evaluate and assess fixed income securities for investment purposes. This includes credit and risk analysis, as well as bond valuation. It applies to securities such as government and corporate bonds, and plays an important role in the trading and pricing of such instruments in the market.
In investment valuation, financial modeling refers to the procedure and methodology performed to determine the value of an asset or financial security
Fundamentally, a business or company’s current value can be viewed as being derived from its future cash flow streams. An investor deciding whether to purchase or sell a stock, therefore, will be interested in estimating such value.
Financial modeling is the creation of a program or structure designed to incorporate a company’s financial information and projections, and subsequently come up with a valuation used for investment decision making.
Uses and Applications
Financial modeling has multiple uses and applications
Portfolio Management and Security Valuation
Analysts and portfolio managers use financial modeling to determine a stock’s fair or intrinsic value
Used as a basis for making investment decisions and recommendations such as buying, selling, or holding financial securities
Investment Banking and Private Equity
Investment bankers use financial modeling to develop valuation figures for merger and acquisition candidates
Private equity investors make extensive use of financial modeling when making investment decisions regarding leverage buyouts and management buyouts
Real Estate Investment
Financial modeling is used by real estate developers and investors in determining the fair value of properties
Corporate Finance
Executive management use financial modeling for capital budgeting decisions such as
Investing in new projects, fixed assets, or equipment
Determining the value-creation or destruction from replacing existing assets or equipment
Key Elements in Financial Modeling
The use of advanced computer software is typically used to conduct DCF. Microsoft Excel is commonly used for its spreadsheet capabilities.
Assume that an analyst would like to use financial modeling to determine the value of a corporation. It can be performed as follows
Historical financial statements are used as a starting point
The company’s historical financial results are tabulated. The following statements are used
Income Statement
Balance Sheet
Cash Flow Statement
Analysts typically use 2-5 years of historical results
Financial projections, financial forecasts, and financial estimates are made
The analyst will use assessment of the economy, industry, and market to make key assumptions regarding future conditions. This forms the basis of determining future projections.
Growth rate estimates or projected values for the company’s key financial statement elements are made, such as for
Revenues, expenses, depreciation, interest expenses, and net income
Assets
Liabilities
Capital expenditure
Debt projections
Development of Pro-forma financial statements
Using the forecasts developed above, the complete set of projected financial statements are developed
Projection of Cash Flows
Cash flows can be defined in several ways
Using the pro-forma statements, the analyst will usually determine the company’s free cash flows
Free Cash flows are the company’s available cash after accounting for capital expenditures and working capital requirements
Such FCFs form the basis of discounted cash flow valuation.
Determination of the Discount Rate
To value the projected cash flows, a discount rate is estimated.
This rate will be used to find the present value of each projected cash flow
DCF Analysis
The value obtained using DCF will be analyzed to determine whether it is appropriate
Usually, DCF is complemented with sensitivity analysis, which takes into consideration various scenarios regarding growth estimates and discount rates,
Investment decision is made
Conclusion
Financial modeling is a valuation methodology or program aimed at determining an asset or financial security’s value for investment decision-making purposes. It encompasses inputs from a company’s historical financial statements, development of assumptions and projections regarding its financial information, and using discounted cash flow techniques or models to produce a valuation figure. It is extensively used in portfolio management, security analysis, investment banking, and corporate finance.
The diligent investor knows that he or she needs relevant, timely, and high-quality information in order to make sound investment decisions.
The earnings reports released by companies can be invaluable in providing such information. Released by public companies on a quarterly and annual basis, they can be used to assess and gauge a company’s:
o financial condition
o strategic plans
o industry and competitive position,
o Key performance drivers and risk factors
o Future performance
SEC REGULATIONS
Publicly-traded companies are required to file earnings reports with the Securities and Exchange Commission on a quarterly (10-Q) and annual basis (10-K). Such reports have to be furnished within a specified timeline after the ending of the company’s accounting cycle.
ELEMENTS OF EARNINGS REPORTS
HIGHLIGHTS
The first section of these reports typically provides an overall summary of the company’s financial performance and key developments. A comparison between current results and prior years’ or quarters’ numbers are used to indicate how the company fared during the period. Brief highlights include:
o Financial results such as sales, expenses, net income, EPS (along with growth percentages from prior periods)
o Performance of key business segments or product lines
o Important industry developments
STRATEGIC AND INDUSTRY ANALYSIS
Within earnings reports, companies will usually provide detailed information regarding the strategic plans of executive management.
Investments in new markets, business segments, or products can indicate the strategic direction the company is heading towards.
Key drivers affecting the execution and performance of such strategies are usually elaborated on.
An analysis of important industry and market developments and their impacts is also commonly presented.
KEY RISK FACTORS
Since the future performance of the company is uncertain, and is dependent on a multitude of unpredictable forces, management usually pinpoints important factors that might have negative impacts to the business.
Such factors can be country, industry, or company-specific or a combination.
Examples include:
Political events
Technological developments
Demographic trends
Inflation
Interest rates
Business cycles and stock market fluctuations
Volatility of prices
MANAGEMENT AND DISCUSSION ANALYSIS (MD&A)
In the MD&A section, executive management (commonly the CEO or CFO) present an in-depth analysis of the financial, operational, and business performance of the company.
An examination of trends and comparison with prior-period results is discussed, with the aim of explaining such fluctuations.
Detailed analysis is provided regarding items such as business segments & product lines, capital investments, production & operations, industry and market developments, mergers/acquisitions, and many other company specific items of interest.
FINANCIAL STATEMENTS AND SUPPLMENTAL SCHEDULES
Prepared in accordance with accounting principles (e.g. US/Canadian GAAP, International GAAP), the company’s financial statements are presented. Additionally, the historical statements are shown alongside current-period numbers for comparison purposes.
Main Financial Statements:
o Income Statement
o Balance Sheet
o Statement of Cash Flows
o Statement of Comprehensive Income
o Statement of Retained Earnings
Supplemental Schedules can include information regarding:
o Operations and production
o Capital expenditure
o Business-segment specific data
o Debt or Long-term liabilities schedules
o Employee stock options
o Other company-specific info
ACCOUNTING PRINCIPLES & RULES
Companies can use a multitude of accounting principles and rules to recognize, present, and report financial results to investors.
Within earnings reports, investors will typically find a section detailing the assumed accounting principles used by the company regarding such items as:
o Revenue recognition
o Expense recognition (the capitalization of expenditures versus expensing them)
o Inventory valuation rules (e.g. FIFO, LIFO)
o Depreciation (e.g. straight-line, declining-balance, etc)
o Investments in other companies and accounting for mergers and acquisitions
o Foreign exchange translations
o Pension accounting
o Off-Balance Sheet items (e.g. leases, SPV)
USING EARNINGS REPORTS TO ASSESS EARNINGS QUALITY
Company management has, at their disposal, numerous accounting principles and rules that they can be used to recognize financial information and report their results to the public, and this presents investors with several challenges.
Recognizing that financial information has a significant impact on the company’s stock price performance (and thus executive compensation) management has strong incentives to choose accounting principles that will allow them to portray the company’s financial position in the best light possible.
A well-informed and diligent investor will scrutinize the company’s assumed accounting principles to assess the impact of the choice of such rules on the reported results. This in turn, will allow the investor to gauge the quality of the earnings (i.e. how reflective they really are of actual performance and financial condition), and adjust their analysis accordingly.
Some accounting principles can be used to:
o Recognize revenue too early
o Excessively capitalize expenses (which defers their negative impact on earnings)
o Report certain gains and losses in comprehensive income, thus bypassing the income statement
o Mask liabilities by overly using off-balance-sheet accounting
o using investment accounting principles to reduce volatility of reported investment results
CONCLUSION
The financial and non-financial information within earnings reports can be used to make sound investment decisions.
They can be an excellent tool in evaluating and valuing the financial health, strategic and industry position, and the future performance of the company.
As such, the well-informed investor will scrutinize all information, including the impact of accounting principles on reported results – which can affect the quality of reported earnings.
Discounted Cash Flow is a valuation technique or model that discounts the future cash flows of a business, entity, or asset for the purposes of determining its value.
One aspect of investment decision-making entails discovering the fair value of investments. The DCF rests on the principle that an asset’s fair value is the present value of all its future cash flows. Investors seek such value to
Determine a fair valuation for assets such as financial securities, business entities or divisions, or any asset that produces future cash flows
Compare an asset’s estimated DCF value with its market price today
Decide whether to purchase an asset or dispose of an investment holding
Compare the values of various assets or financial securities
Uses and Roles of DCF
DCF is used in areas such as
Portfolio Management
Financial analysts use DCF to find the fair or fundamental value of financial securities such as stocks and bonds
Using DCF estimates, analysts make stock buy or sell recommendations to their clients
Portfolio managers use DCF results to decide on which financial securities to add or remove from their portfolios
Typically, DCF analysis results in comparison between an asset’s DCF value and its market price
If DCF value > market price = asset is undervalued
If DCF value < market price = asset is overvalued
If DCF = market price, asset is fairly valued
Investment Banking and Private Equity
Investment bankers use DCF to determine appropriate values for transactions in
Mergers and Acquisitions
Leverage Buyouts
Management Buyouts
Corporate Finance and Management
In corporate finance, DCF is used in capital budgeting to assess the profitability of company-specific projects such as
Investing in new fixed assets or equipment
Replacing existing assets or equipment
Investing in new business divisions or subsidiaries
How is DCF performed?
DCF uses a time-value based formula to determine the value today, of a single or set of future cash flows. The main steps in performing DCF can be summarized as follows
Define a time period or horizon
DCF models require a time period for which the future cash flows will be projected
Time horizons are typically chosen between 1-10 years
However, the longer the period chosen, the more uncertainty there will be regarding forecast figures
Determine the discount rate
This is the rate used to find the present value of all future cash flows
Depending on the asset being valued, the discount rate can be
The cost of equity
The cost to the firm of its equity capital. This is basically the return demanded by its equity or stock holders
Used when valuing a firm’s equity or stock
The weighted average cost of capital (WACC) – also referred to as the cost of capital
Used to find the value of the entire company or firm
Takes into consideration the cost of all sources of capital providers: common equity holders, preferred equity holders, and debt holders
Define the asset or financial security’s cash flows. For example, they can be defined as
Dividends
Free cash flows
Find the asset’s current cash flows or earnings
This is found by looking at current financial statements and determining the company’s current or historical dividends or free cash flows
Develop expected or projected growth rates
Growth rates will be used to forecast expected future cash flows within a specified time horizon
With multiple and indefinite future cash flows, determine a perpetual or stable growth rate
Usually when valuing company cash flows, an assumption must be made regarding when a company’s cash flows will “stabilize” and grow consistently at the same rate into the future
Using the projected growth rates, determine the future cash flows within the time period specified
Using the discount rate above, find the present value of each future cash flow component
Advantages and Disadvantages
Advantages of DCF
Is a fundamentally sound valuation technique that can be used to determine fair or intrinsic value
DCF can be used to assess the market’s gauge of a particular investment’s value.
DCF is particularly useful with companies that generate stable cash flows
Can be used with companies that have negative earnings
Disadvantages of DCF
It can be very hard to make accurate projections
DCF Values are also highly sensitive to its assumptions and estimates. Even minor changes in estimates can cause large swings in value, which causes uncertainty to be large
DCF is geared for long-term investing horizons, and might not suitable for short-term investors.
In some cases, a long time horizon is needed, which makes the assumptions even more uncertain
Conclusion
The Discounted Cash Flow model or technique is a method used to determine an asset’s fair or intrinsic value. Its premise rests on the principle that an asset’s fundamental value is the sum of the present values of its expected future cash flows. The present value of such cash flows is found by discounting their future values using a discount rate. DCF is an important valuation tool extensively used in portfolio management, investment banking, and corporate finance
The Debt-Snowball Method is a debt-management strategy aimed at reducing a borrower’s obligations
Borrowers can use this method to slowly eliminate their debt by focusing on their smallest debt balance, followed by larger ones until all obligations are paid off.
Doing so can:
Substantially reduce debt in the long-term
Improve credit ratings by making small minimum payments over a long period of time
Be used to create good payment habits
Debt Snowball Steps
The Debt-Snowball method can be done using the following steps
Compile a list of all debt obligations incurred to date
List the debts from the smallest owed to the largest owed
The order arrangement of debts depends on the amount (or size) of the debt owed, rather than the actual interest rate
For each of the debts listed, the best efforts must be made to meet the minimum required payment, regardless of size
Make an effort to set aside or save extra funds each month
These extra funds that must be set aside after making the minimum required payments on all the debts above
Direct the extra funds saved towards paying off the smallest debt owed
Make consistent extra payments, until all the debt is eliminated
These are payments in addition to the minimum required amounts
After eliminating the least owed debt, use the same strategy to eliminate the next smallest debt
Use the funds directed towards the minimum required payment of the previous debt, plus any extra funds saved, towards payments on the next smallest debt
Continue this debt-reduction strategy until eventually all debt is eventually paid off
Rationale
Having a significant amount of debt can be over-whelming and stressful. Having a debt-reduction strategy can help an individual use an effective plan and method to tackle one debt problem at a time.
Some rationales for using the debt-snowball method include
A simple way of reducing a lot of debt
By making consistent small payments towards debt, the borrower will feel psychologically motivated to stick with his or her debt-reduction strategy as they see their debt load reduced
Using this method, all borrowers debts are reduced at a certain portion every period
Disadvantages
Disadvantages include
The method does not address the loans with the highest interest rate attributed to them. These are the debts that are the costliest since they incur a heavy interest charge.
Requires that all minimum payments on all debt be made. Therefore, this strategy may not be suitable for low-income earners
The length of time required to eventually pay off all debt can be significant
Conclusion
The Debt-Snowball method is a debt management and reduction strategy used to help borrowers reduce and eventually eliminating their debt burdens. Its principle rests on paying down one’s debt from the least amount owed to the greatest. While making the minimum required payments on all borrowed amounts, surplus or saved funds are directed towards paying off each debt amount until everything is eventually repaid.
 Belgium is an EU member located in Western Europe. It has a strong industrialized economy, well-developed transportation infrastructure, and a highly productive work-force making it an attractive destination for foreign capital.

 Italy is an EU member country and one of G-8 leading industrialized economies, having the seventh largest economy in the world. Its thriving small and medium enterprises play an important economic role. Italy has world-leading companies in manufacturing, automobiles, textiles, and agriculture.
 Ireland is an EU member country with a knowledge-based economy and strong industries in services and technology. With attractive corporate tax rates, Ireland has been ideal destination for multinational corporations.

 Hungary is an EU member country with a medium-sized, liberal economy that is rapidly developing. It has the 5th largest economy in Central and Eastern Europe, with major exports in machinery, chemicals, textiles, and agricultural products.

 Peru is a Latin American country with an emerging, market-oriented economy that has been among the top performers in South America. Rich in natural resources, it is a major exporter of gold, copper, zinc, and fish.


 Austria is an EU member and currently the 12th richest country in the world. It has experienced sustained economic growth and attracts many foreign investors. Austria is home to internationally reputable law firms and banks, and has a vibrant tourism sector.