So school is almost out, your students are already gazing out the window, and the last of your lessons are just about finished. Now what?

Studies across the United States show that students forget math the most over their Summer Break, so the best thing a teacher can do for their students as they go out into the world is setting up fun, long-term projects that students can keep engaged with for an hour or two a week, keeping their math skills at their peak.

Education World found that stock market games are one of the best activities students can do to improve their skills in math, economics, and personal finance education, blending great interactivity of managing a portfolio made up of many different companies to research, analyze, and think about, improving both mathematics, critical thinking, reading, and research skills with students at every grade level. The competative element of seeing their portfolios rise and fall in relation to their classmates keeps students coming back, and trying to think of new strategies to stay at the top of the game.

Some great places to start include:

  • Set up a Stock Market Game for your class over the Summer, as a prize you can offer our Winner’s Certificate
  • Set up an Assignment – ask students to make a trade every week, and brush up on their investing skills with some articles and quizzes!
  • Utilize the Class Forum – you (and your students!) can post messages and keep in touch even after classes are out
  • Take a look at some of our other Lesson Plans to give long-running projects over the summer months!
  • Send your students articles from our Education Center to keep them interested in personal investing!

We will be adding more content and lesson plans, both ones we develop ourselves and ones submitted by teachers all around the world, to help build fun and engaging Summer programs that help make sure your students keep learning even outside of school.

Time to get excited, and get ready for summer!

Welcome to our Videos section, where you can see all the great features of our new site, all in one place! If you think something is missing here that you would love to see, send a ticket to our Support Desk, and we will get it made and posted as soon as possible! All these videos are for our New Site!

Introduction To Our Site

Navigating The Site As A Student

My Portfolio, Open Positions, And Rankings Pages

Trading Stocks

Trading Mutual Funds

Using Different Order Types

Research on HowTheMarketWorks

Short Selling

Teacher Tools And Research

Creating your own contest? Looking to start doing stock research? Wanting to look at some more advanced order types? This is the place!

Contest Creation

Creating Assignments

The most difficult thing people think of with personal finance is building your monthly budget, and sticking to it. There are tons of different expenses and payments to consider, so we put all the big ones in one place! This tool will also help you see exactly how much you can set aside for savings every month!

If you have already used our Buy Vs Lease Calculator to see how much your home payments will be, use this value to build a budget around the expenses you know you will have!

Once you have built a monthly budget, and see how much you can save, take that to our Saving To Be A Millionaire Calculator to see how long it will take to earn $1,000,000 with that saving level!

Javascript is required for this calculator. If you are using Internet Explorer, you may need to select to

‘Allow Blocked Content’ to view this calculator.


The first BIG purchase many people make is when they buy their first car. This calculator will help show the impact of many of the biggest factors people need to consider when taking out their first loan for a big purchase.

If you have used our Credit Card Payment Calculator to see how minimum payments on small loans are made, you might want to start to think what happens when you make bigger purchases, with bigger loans.

Once you have found the payments you can make on a car you can afford, check out our Buy Vs Lease Calculator to start seeing when actually buying a big purchase is REALLY cheaper than renting!


Credit Cards! These are usually the first “loans” a person takes out, and the first monthly payments! Tens of thousands of young people dig themselves deep into credit card debt before they even realize it, so have fun with this payments calculator to see how much these bits of plastic REALLY cost!

If you have already used our Compound Interest Calculator, try using the same interest rate you hoped to save at as the same amount your credit card company charges. Then double it to get a more realistic picture!

Once you have seen the impact that taking out loans can have at different interest rate and payment schemes, check out our Car Loan Calculator to see how you can budget a big purchase without losing your wallet!


Born To Sell is all about covered calls. Their award-winning covered call screener has an easy-to-use interface and provides covered calls matching any query you give it.

Every day there are over 350,000 covered calls to choose from. That represents thousands of underlying stocks and ETFs, each with dozens of strike prices and expiration dates (including weeklys). Born To Sell’s covered call screener lets you filter and sort all those options so that you can find ones that meet criteria that you’re looking for.

For example, maybe you want stocks that pay a dividend before option expiration, that do not have an earnings release before expiration, have a P/E of less than 20, and offer in-the-money covered calls with an annualized rate of return over 20%. Set the filters and you’ll see the results. Change any filter and the results update immediately.

Or maybe you want to see all the covered calls that have an annualized return over 15%, sorted by downside protection (deepest in the money on top). Easy to do.

In addition to screening for covered calls, Born To Sell also offers portfolio management features that track your covered call positions. You can see at a glance how much time premium remains in each position, and use their Roll Me tool to help you decide which option to roll to. The software helps you stay organized, stay diversified, and maximize your income each month.

Although it is a subscription service, there is a 2 week free trial for anyone who wants to try before they buy. Click here to read more about it or sign up for the free trial.
Click here to try it.

Have you attended a HowTheMarketWorks presentation at a conference and want to have a copy of the powerpoint presentation that was used?  You have found it!

Representatives from HTMW and Stock-Trak, the parent company, attend dozens of conferences each year to spread the good word about this site.  Below is a link to the latest presentation used by the HTMW team.

Click Here To Download

If you want to contact a HTMW team member that you might have seen at a conference, please call the main office at 1-514-871-2222 or email us at :

Mark Brookshire mark(at)StockTrak.com
Greg Brown gbrown(at)StockTrak.com
Andrew Zeidel azeidel(at)StockTrak.com

chartsWe’ve added some great new charts to the Open Positions page! Once you’ve purchased any stock or ETF, you can view your portfolio as a series of charts showing each stock’s performance. You can switch between the day’s change, for the last 30 days, or even the whole last year. Best of all, the charts are color-coded: Green if you’re making money and red if you’re losing it, so it is easy to see what is making your portfolio move the most.

pie chart
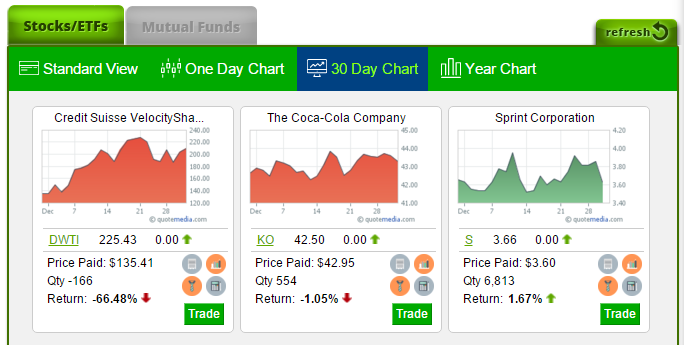
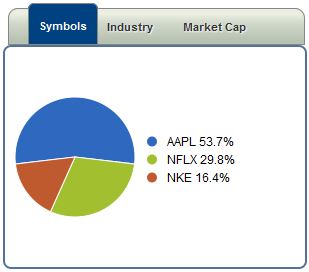
Besides the awesome new charts, we’ve made some huge improvements to the Pie Chart on the right side of the page.

The Pie Chart will now show how your portfolio is split between different stocks, how it is split by industry classification, and even how much you’re investing in big companies compared to small ones (“Market Capitalization”). The industry and market cap filters are provided by our data provider, and will continue to improve as we move forward.

However, if you’re new to HowTheMarketWorks and want a quick way to get started, we’ve also made an improvement just for you: if you don’t currently have any stocks in your portfolio, we will give you a rotating list of the most popular stocks trading right now (with the company logos and current day’s price movement).

It has never been easier to manage your portfolio, so check it out today!

As always, there have been tons of small changes, bug fixes, and performance improvements put in place every week. At this time, we have stopped further development of the old version of the site. New users and classes are encouraged to register on the new site, which is still found at new.www.howthemarketworks.com.

The first thing to consider with all personal finance is the idea of compound interest! This is what separates the “Piggy Bank” savers from the Warren Buffets; making use of interest compounding is how you can really make your savings grow!

If you have already used our Investment Return Calculator, you can use this calculator to see how different types of compounding will affect your overall return!

Once you can really see the impact of interest compounding and growth, try out our Credit Card Payments Calculator to see what happens when you are paying interest, not earning it!


Find out the difference between Simple and Compound Interest! See how big an impact your tax rates and inflation have on your savings over time!

If you have already used our Becoming A Millionaire Calculator, you can use your targeted Expected Investment Return numbers in this calculator to see how to make that return happen!

Once you see how moving the rate of return affects your profits, try checking out our Compound Interest Calculator to see how the different types of compounding can have a big impact on the final return!

Make sure you click the VIEW REPORT button below!
 

Check out some of our other calculators:


How to Become a Millionaire Calculator

millionaire

(A lesson in compound interest.)

Want to be a millionaire? Everyone does, but do you know how much you need to save and what rate of return you need to get on your investments to reach that million level? This financial calculator helps you learn how your savings grows over time and how sensitive your final savings balance is to the rate of return you are earning.

  • Did you know if you start saving $100 a month on your 18 birthday and put that money in a piggy bank, by the time you are 65 you will have $56,400 in your piggy bank (and $0 in interest).
  • But if you put that $100 a month in a bank savings account that paid 3% interest then by the time you are 65 you will have $122,425 in your bank account? That’s the $56,400 you saved plus the bank paid you interest of $66,025.
  • That’s a big improvement, but if you could earn 8% return on your $100 monthly savings, then by the time you are 65 you will have $566,754 in savings! This example uses 8% because that is the historical return of the stock market.
  • Better yet, if you save twice the amount per month ($200 instead of $100) you will have exactly twice the value at age 65, or $1,133,508.
  • So how do you become a millionaire? Start saving $177 a month on your 18th birthday, earn 8%, and have a bank account worth $1,003,155 on your 65th birthday.

If you have used our Home Budget Calculator, you can use your monthly savings plan with this tool to see how long it will take to reach your savings goal!

Once you see how big of an impact the Expected Rate of Return has on your savings growth, take a look at our Advanced Investment Return Calculator to see more details on how to make those big returns happen!


The biggest expense most people have is the place they live, one of the biggest decisions young people face is whether to buy their home, or continue to rent. Conventional wisdom says that buying will pay off in the long term, but believe it or not this is not always the case!

If you have used our Car Loan Calculator to see what kind of loan you can afford with your budget, you can use the same numbers you ended with there to get a great idea of where your personal cut-off would be between whether to Buy or Lease!

Once you know what kind of home you are getting, and how much you would have to pay a month, check out our Home Budget Calculator to build a budget around your expenses, and determine how much you are able to save every month!


We want to make it as easy as possible to teach real personal finance skills to your students, so we have been working with our friends at EconEdLink.org, along with our own team of personal finance experts and educators, to build a set of the best lesson plans and teacher resources anywhere in the world.

We also have dozens more lesson plans on different topics you can browse!

This collection covers other Personal Finance Lesson Plans that don’t fit well in those other groups.

Personal Finance Lesson Plans for All Age Groups

HowTheMarketWorks Lesson 1: Using The Stock Game In Personal Finance

  • Topic: Business and Stocks
  • Personal Finance Standard Covered: Investing (Standard 2) – Evaluate investment alternatives.
  • Source: HowTheMarketWorks
  • Description: This lesson plan is designed to give students the basics of what defines a “business” and why companies issue stock. It also covers a large amount of basic finance vocabulary, with practical examples.

Click Here To Access This Lesson Plan

 Personal Finance Lesson Plans for Elementary School and Up

Money Doesn’t Grow on Trees

  • Topic: Money
  • Personal Finance Standard Covered: Employment and Income (Standard 2) – Compare sources of personal income and compensation
  • Source: EconEdLink, by Patricia Bonner
  • Description: In this lesson students will identify methods for getting money, explain what to do when they find money and other things that belong to someone else, create a plan for earning extra money and conduct a survey to learn more about typical allowances provided to people their age.

Click Here To Access This Lesson Plan

What Do Other People Want To Be?

  • Topic: Career Planning
  • Personal Finance Standard Covered: Employment and Income(Standard 1) – Explore job and career options
  • Source: EconEdLink, by Connections Cross-Curricular
  • Description: Students identify several major career paths, and build graphs based on graphs of different people’s job choices. They can then visualize which jobs have the most competition.

Click Here To Access This Lesson Plan


Personal Finance Lesson Plans For Middle School And Up

Online scams and schemes

    • Topic: Scams
    • Personal Finance Standard Covered: Financial Decision Making (Standard1) – Recognize responsibilities associated with personal financial decisions.
    • Source: InspireFinancialLearning.ca
    • Description: In this lesson, students will learn ways to avoid financial scams and schemes designed to defraud customers.

Click Here To Access This Lesson Plan

About Consumer Privacy

  • Topic: Personal Information
  • Personal Finance Standard Covered: Financial Decision Making (Standard 7) – Control personal information
  • Source: Practical Money Skills
  • Description: The goal of this lesson plan is to provide students with an awareness of the importance of protecting their personal information and the potential consequences of their privacy being invaded by scam artists and identity thieves.

Click Here To Access This Lesson Plan

College: Where Am I Going To Go?

  • Topic: Career Planning
  • Source: EconEdLink, by Mick Duckworth
  • Description: This lesson plan introduces students to the opportunity cost of choosing one school over another, and a wealth of other information about how to look for schools, and how to approach applying for universities, and much more.

Click Here To Access This Lesson Plan

Entrepreneur!

  • Topic: Career Planning
  • Source: EconEdLink, by Connections Cross-Curricular
  • Description: This lesson plan is designed to help students understand why people start their own businesses, some of the risks, and some of the biggest challenges of getting their ideas off the ground!

Click Here To Access This Lesson Plan


Personal Finance Lesson Plans For High School And Up

Inflate your knowledge

    • Topic: Inflation
    • Personal Finance Standard Covered: Employment and Income (Standard1) – Explore Job and Career Options.
    • Source: InspireFinancialLearning.ca
    • Description: In this lesson, students have an opportunity to experience the effects of inflation first-hand through an interactive classroom auction! Students will learn about the Consumer Price Index (CPI) as a measure of purchasing power and standard of living and apply their knowledge to goods and services they purchase today.

Click Here To Access This Lesson Plan

Living on Your Own

  • Topic:Cost of living alone
  • Personal Finance Standard Covered: Financial Decision Making (Standard 5) – Apply communications strategies when discussing financial issues
  • Source: Practical Money Skills
  • Description: This lesson will help students understand the costs of living on their own and provide practice in setting up budgets. Help students to develop the skills and knowledge necessary to interpret and evaluate lease/rental agreements.

Click Here To Access This Lesson Plan

Open for Business!

  • Topic: Entrepreneurship
  • Personal Finance Standard Covered: Employment and Income (Standard 1) – Explore job and career options
  • Source: EconEdLink, by Marsha Masters
  • Description: This engaging lesson gives students the opportunity to identify risks and rewards of entrepreneurship and distinguish between entrepreneurs who start a business to produce a good or provide a service.

Click Here To Access This Lesson Plan

Invest in Yourself

  • Topic: Human Capital
  • Source: EconEdLink, by Scott Niederjohn
  • Description: In this lesson students will explain how human capital is related to career choices, opportunities, and income. They will define opportunity cost and give examples of it.

Click Here To Access This Lesson Plan

Want More? Click Here To Browse Our Full Collection Of Personal Finance Lesson Plans!


Welcome to HowTheMarketWorks, The Best Free Stock Market Game!

Get ready for our webinar series, where we will go through all the features of using HowTheMarketWorks in your class or club, and answer any questions you may have about the totally FREE platform!

If you missed our last webinar, you can view a recording of our Best Practices and Recommendations webinar below:

We give all webinars based on what works best for you! Leave your details below and we will send you an email with the details on the next webinar that fits your schedule. If you do not find a session you can attend on this list, just contact support@howthemarketworks.com to set up a new one!

Technical analysis software gives a user the ability to quickly manage information and is often provided by a brokerage for free or a small premium. You can also get the software without having a brokerage.

These software allow users to perform a variety of tasks depending on the specific tool you use.

They often have but are not limited to charting, news, fundamentals, trade automations, back testing, and many other features that are useful for trading. It is important to note that they are called technical analysis software they are not limited to just technical analysis; many can be used as stock screeners, fundamental research tools, and much more.

Anyone interested in day trading stocks should be familiar with the basics of technical analysis, and try one or two software packages to see what all the fuss is about.

Click Here to see a list of some of the technical analysis software packages we have reviewed.

Introduction

Chile is one of Latin American countries that have a vibrant market-oriented economy and an OECD member. It depends heavily on foreign trade due to its natural resources, and is a dominant and major exporter of copper.

Chile’s Main Industries

 Chile is economically known for its strength in:

  1. Mining and Minerals Sector
    1. Copper
    2. Lithium
  2. Agriculture Sector
    1. Fishing
      • Salmon
    2. Fruits and Vegetables
  3. Forestry Sector
    1. Radiata Pine
    2. Eucalyptus
      • Pulp
    3. Wood
    4. Lumber
  4. Services Sector
    1. Tourism

Chile’s Main Stock Exchanges

The two main stock exchanges in Chile by size are:

  1. Santiago Stock Exchange
    1. Chile’s dominant and principal secondary market
    2. Trading occurs in equities, bonds, derivatives, and commodities
    3. Main Index
      1. IGPA Index
      2. IPSA index, published by the exchange, contains Chile’s 40 most liquid stocks

    4. Private pension funds constitute an important investor group
  2. Santiago Electronic Stock Exchange
    1. Allows online trading
    2. Based on its real-time,  electronic-trading platform SITREL
    3. Trading in equities, bonds, derivatives, and foreign exchange

NOTE: The Santiago Stock Exchange has formally merged its stock exchange trading activities with those of Colombia and Peru, to form the Mercado Integrado Latino Americano (MILA), which will allow increased cross-listings of the three countries’ companies.

Glimpse into Chile’s Equity Market

Chilean equities weathered the 2008 economic crisis quite well, mainly due to a lack of exposure to the banking crisis and its commodity-rich resources and exports. The IGPA and IPSA Indices climbed above 35% in 2010, and have outperformed many other Latin American equities.

In $US dollar terms, market capitalization of listed equities surged by over 60% during 2010, from $US 209.5 billion in 2009.

After experiencing lacklustre IPO activity since 2005, Chile is witnessing a busy IPO season in 2011 with Chilean companies expected to raise up to $10 billion through 2012.  The recent integration of its securities exchange trading with Colombia and Peru may further bolster IPO levels.

Stock Index Performance 2011: IGPA

2011 Values:


Last


-1 Mo.

-3 Mo.

-6 Mo.

-9 Mo.


-1 Yr.

-3 Yr.

-5 Yr.

-10 Yr.


6/10/2011


5/10/2011

3/10/2011

12/10/2010

9/10/2010


6/10/2010

6/10/2008

6/12/2006

6/11/2001


Price

22,466.37


22,983.36

20,924.79

23,012.71

22,106.52


18,359.26

14,366.34


2011 Performance:


YTD


-1 Mo.

-3 Mo.

-6 Mo.

-9 Mo.


-1 Yr.

-3 Yr.

-5 Yr.

-10 Yr.

Value Change

-68116.00


-516.99

1,541.58

-546.34

359.85


4,107.11

8,100.03


% Change


-2.25%

7.37%

-2.37%

1.63%


22.37%

56.38%

132.25%

311.97%

Source: Datastream


Chile’s 10 Most Profitable Companies in 2010

Rank

Company

Industry Group

Sector

Symbol/Ticker

  Profit ($ mil)

Revenue ($ mil)

1

 Axxion SA

 Real Estate

Financials

 AXXION-SN

                    1,127.70

                719.42

2

 Empresas Copec SA

 Petroleum Refining

 Energy

 COPEC-SN

                    1,105.33

           13,246.86

3

 Banco De Chile

 Banks

Financials

 XBCH-MC

                       892.43

             3,288.51

4

 Saci Falabella

 Retailing

Consumer Discretionary

 FALABELLA-SN

                       883.31

             9,454.65

5

 Banco Santander-Chile SA

 Banks

Financials

 BSANTANDER-SN

                       850.18

             3,383.84

6

 Empresas Cmpc SA

 Paper Products

Materials

 CMPC-SN

                       695.11

             4,600.15

7

 Antarchile SA

 Petroleum Refining

 Energy

 ANTARCHILE-SN

                       657.42

           13,257.42

8

 Cap SA

Steel Mills

 Materials

 CAP-SN

                       643.67

             2,173.60

9

 Cencosud SA

Retailing

Consumer Discretionary

 CENCOSUD-SN

                       633.10

           13,237.98

10

 Quinenco SA

Diversified Financials

Financials

 QUINENCO-SN

                       623.16

             2,789.64


Ways to Invest in Chile
There are a couple of different ways to invest in Chilean companies:

  1. Through a Chilean Bank
    1. Regional banks in Chile allow investors to purchase equities
      • Banco de Santiago
      • Banco Credito Inversiones
      • Banco de Chile
    2. Through a foreign bank located in Chile
      • HSBC
      • Citibank
      • Banco Santander
  2. Canadian ETFs
    • ECH:NYSEArca – tracks the iShares MSCI Chile Index Fund
  3. Through some international online brokers:
    1. MB Trading
    2. Interactive Brokers
    3. TD Ameritrade
    4. E-Trade
    5. Questrade
    6. optionsXpress
    7. optionshouse
    8. tradeMONSTER
    9. Charles Schwab


Introduction

Serbia is a European country with an upper-middle income economy. It had one of the fastest growing economies of its region, in terms of GDP growth rates prior to the global recession, and attracted solid foreign direct investment.


Serbia’s Main Industries

Serbia is economically known for its strength in:

  1. Agriculture Sector
    1. Fruits
    2. Vegetables
    3. Live cattle
  2. Mining and Metals Sector
    1. Iron
    2. Steel
    3. Non-ferrous metals
  3. Industrial and Manufacturing Sector
    1. Metal processing
    2. Machinery
    3. Mechanical and household appliance production
    4. Consumer electronics
    5. Food Processing
    6. Textiles and Footwear
  4. Forestry Sector
    1. Timber
    2. Wood
  5. Natural Resources
    1. Oil
    2. Coal
    3. Copper
    4. Lead
    5. Zinc
    6. Bauxite
    7. Iron Ore


Serbia’s Main Stock Exchanges

The main stock exchange in Serbia is the Belgrade Stock Exchange (BELEX)

  • Founded in 1894
  • In 2004 became a member of the Federation of Euro-Asian Stock Exchanges
  • Trading mainly occurs in equities and debt of listed Serbian companies. Future plans are underway to include other instruments such as rights, warrants, and derivatives
  • Serbia’s Main Index is the BELEX 15 – consists of Serbia’s 15 most heavily traded listed companies

Glimpse into Serbia’s Equity Market

After experiencing significant negative impacts from the global recession, and performing quite poorly between 2008 and 2009, Serbian equities have rebounded in 2011 with a promising outlook for the near-term.
However, the Serbian stock exchange is not very liquid, which adds to its risk. As such, the good performance could be largely liquidity-driven and investors remain cautious. The Belex 15 stock index has increased around 15% since the beginning of 2011, with its energy stocks performing particularly well.


Serbia’s Top 10 Companies

Rank Company Profit 2009 (Euro) Revenue 2009 (Eur) Revenue Growth (YoY)

  1. Naftna Industrija Srbije AD -393,851,753 -92,165,916 -27.14%
  2. JP Elektroprivreda Srbije -144,741 -24,991,065 4.65%
  3. Telekom Srbija AD 162,153,620 62,646,388 1.63%
  4. JP Srbijagas 9,873,843 3,397,005 -4.78%
  5. Delta Maxi DOO 18,989,256 18,560,216 8.65%
  6. Termoelektrane Nikola Tesla DOO -17,739,454 -97,846,294 5.48%
  7. U.S. Steel Serbia DOO -153,051,128 4,914,422 -44.37%
  8. Mercator – S DOO 12,071,671 -4,259,543 318.49%
  9. Elektrovojvodina DOO -6,931,560 -8,322,647 2.99%
  10. YugoRosGaz AD 13,715,564 23,495,704 -32.94%


Ways to Invest in Serbia

There are a couple of different ways to invest in Serbian companies:

  1. Through a bank in Serbia
    1. AIK Banka
    2. Banca Intesa Beograd
    3. OTP Banka Srbija
    4. Alpha Bank Beograd
    5. Piraeus Bank
    6. Raiffeisenbank Beograd
    7. Volksbank Beograd
  2. ETFs with some exposure to Serbia
    1. ESR:NYSEArca– seeks to track the MSCI Emerging Markets Eastern European Index Fund
    2. GUR:NYSEArca – SPDR S&P Emerging Europe ETF

After months of development behind the scenes, the new version of HowTheMarketWorks is now live and available for all users to test out!

New features we’ve added in this major update:

  • Users can now join as many contests as they like! You are no longer limited to just 3.
  • Trade execution time is much faster – this means that the rankings are more accurate and there is no way for any users to “cheat the system”.
  • The current live quote is now on the trading page for each stock, so users do not need to preview their order before having an idea of how much the trade will cost
  • Charts have been added to the Trading page so you can get a clear view of the stock’s performance for the current trading day
  • Private contest forums where groups can post messages visible only to other members of their contest

We have also added a shop where users can buy HowTheMarketWorks merchandise like t-shirts and coffee mugs. This is the only part of the site that is not completely free, but everyone is encouraged to buy some merch to support our team!

The site has been fully re-built from the ground up with dozens more smaller updates around the site, see if you can find them all!

The site is still being tested to iron out all the kinks – the old version of the site will stay at www.howthemarketworks.com, we will have the new version at new.www.howthemarketworks.com, and everyone is invited to join in for testing. We will be holding our Official November Contest on the new site, with $500 in prizes available to the top finishers. Your portfolio on the old site will not carry over here, you will need to re-register, and will log in using a username instead of your email address.

A cup-and-handle chart pattern resembles a cup of coffee with a cup (half circle) and handle (downwards trading pattern). It is a bullish continuation pattern that marks a pause (sideways trend) in the bullish trend. The entire pattern can be anywhere between 1 month to a little more than year. The handle should generally by anywhere from a quarter to a little less than a half of the cup duration.

The cup should be well rounded, it can be fairly steep but should not be so abrupt that it looks like a V. It should also not be so flat that it could be mistaken for a straight line. The handle should be a fairly narrow downward or flat trend.

The cup and handle should always start with an upward trend. The height of the cup and the initial up trend are also important to have a successful cup and and handle pattern. The height of the cup should be approximately between one third (1/3) to two thirds (2/3 of the initial upward trend.

For example, if we have a stock that initial moved from 20 to 30$ and then started to create a cup, the height of that cup should be between about 3.3 (1/3 * 10) and 6.6 (2/3 * 10).

cupandhandle

As with most technical analysis patterns, there are guidelines to indicate the strength of the trend.

1. The closer it is to a nicely rounded cup, the stronger the trent
2. The “handle” can only convert to a breakout when there is strong volume.


Latvia is an EU member country that experienced superior GDP growth rates prior to the financial crisis in 2008. It underwent significant privatization, which resulted in large foreign direct investment inflows. Its economy was ranked first among developing countries until 2008.

Latvia’s Main Industries

Latvia is economically known for its strength in:

  • Pharmaceuticals and Chemicals Sector
    • Phytopharmaceuticals
    • Paints and varnishes
    • Chemical compounds
    • Synthetic fibres
    • Cosmetics and perfume
    • Plastic and rubber products
  • Biotechnology Sector
  • Industrial and Manufacturing Sector
    • Electronics Manufacturing and Engineering
    • Electrical Engineering
    • Textile and Clothing Sector
      • Cotton
      • Wool
      • Garments and accessories
      • Linen
      • Synthetic fibre
  • Agriculture Sector
    • Fruits and Vegetables
    • Bread and Grain
    • Fish
    • Dairy
    • Meat
    • Beverages
  • Forestry Sector
    • Timber
    • Wood
    • Pulp
    • Paper
    • Fibreboard

 Latvia’s Main Stock Exchanges

 The main stock exchange in Latvia is:

A) Riga Stock Exchange (currently NASDAQ OMX Riga)

  1. Founded in 1993 as the Riga Stock Exchange
  2. Is a self-regulating organization, owned by the NASDAQ OMX
  3. Utilizes the highly advanced trading technology (INET)
  4. Serves trading in equities, fixed income, derivatives, and depository receipts
  5. Currently has 30 members on the exchange
  6. Indices

B) OMXR/RIGSE Index


Latvia’s Economic and Investment Performance

After superior growth, Latvia’s economy suffered a severe contraction mainly due to a credit-induced high consumption and bubble. Prior to that, it was a hub for foreign investment and capital, after privatisation led to its economy opening up.

After ranking first among developing countries, it suffered a significant economic contraction. Nevertheless, sound economic and investment policies enabled it to stabilize in 2010 and it remains a promising country with strong potential.


Latvia’s 10 Most Profitable Companies in 2010

Rank Company Symbol : Ticker Profit ($millions) Revenue ($millions)
1 Latvijas Gaze GZE1R-RG 668.29 48.78
2 Grindeks GRD1R-RG 123.22 13.45
3 Latvijas Balzams BAL1R-RG 98.84 7.42
4 Olaines Kimiski-Far OLF1R-RG 47.81 6.69
5 LATVIJAS TILTI AS LTT1R-RG 42.45 3.77
6 SAF Tehnnika SAF1R-RG 18.03 2.57
7 Valmieras Stikla Skiedra VSS1R-RG 74.08 1.17
8 Ditton Pievadkelu AS DPK1R-RG 14.6 0.72
9 BRIVAIS VILNIS AS BRV1R-RG 13.49 0.66
10 LIEPAJAS AUTOBUSU PARKS AS LAP1R-RG 10.15 0.45


Ways to Invest in Latvia

There are a couple of different ways to invest in Latvian companies:

  • Through a Latvian Bank
    • Aizkraukles Banka
    • Danske Bank
    • Nordea Bank
    • DnB NORD Banka
    • SEB Banka
    • Swedbank
  • ETFs
    • ESR:NYSEArce – has exposure to various Eastern European countries including Latvia