The Sharpe Ratio is an important tool for evaluating a stock, or a portfolio, based on how risky it is to get a higher return. You can use the Sharpe Ratio to determine how consistent the returns of a stock or portfolio are, so you can determine if the returns are stemming more from wise investing, or getting lucky.
Example
Look at the performance of these two stocks:
On the first day we track and the last day, these two investments have the same value. However, Stock 1 is very consistent in its returns, while Stock 2 has a very wide range of variance. In this example, if an investor holds both these stocks for 13 days, their return would be the same for both.
However, imagine if the investor sold both stocks on Day 11. The return for Stock 2 would be much higher! But if they waited just one more day, on day 12 Stock 2’s value crashed down, so Stock 1 looks like a better choice.
How To Use The Sharpe Ratio While Investing
When saving and investing, the goal should always be consistent returns and capital preservation; you do not want to make risky moves that could wipe out all the savings you put in. A wise investor would always prefer Stock A, since they do not need to worry about timing the market, instead they can focus on building a strong long-term portfolio, instead of focusing on when to buy and sell some hot stocks at the best prices.
In this example, Stock A would have a much higher Sharpe Ratio than Stock B, because it has much less variance for the same return at the end of the period we looked at.
You can expand this concept to an entire portfolio; if your portfolio value swings up and down a lot, but you end with a higher value, you will have a much lower Sharpe Ratio than someone else who may have a lower final return, but their portfolio value grew at a more consistent rate throughout the trading period.
The Chairwoman of the Open Market Committee of the Federal Reserve Bank, Janet Yellen, announced today that the prime lending rate will almost certainly be increased this year, based off strong labor market data and economic growth around the United States.
The Federal Funds Rate has been set near 0% for the past several years as part of the Fed’s efforts to use monetary policy to help the economic recovery in the United States. This interest rate is used to determine the interest rate that banks use to lend cash to each other, which also influences the interest rates that companies and people can borrow money.
The lower the interest rate, the cheaper it is to borrow money, so companies can borrow more money to expand, and people can buy more houses (and more houses are built). However, if people are borrowing too much money, it will eventually lead to too much risk in the economy. The Fed generally raises interest rates while the economy is growing strongly, and lowers them when the economy is having trouble.
We have been giving a lot of attention to Greece and China recently in our “Top Stories”, and with good reason!
Greek debt has been spiraling outwards since the financial crash in 2008, but there has been severe resistance to “austerity measures” (another way of saying spending cuts, usually targeting social programs like retirement pensions) that would be necessary to balance their budget and get on good terms with their creditors (particularly France and Germany). The referrendum on July 5th was engineered by the current Prime Minister, Alexis Tsipras, who was elected on the promise to fight these measures and prevent drastic cuts to social spending.
However, by avoiding these cuts, it meant that Greece would be unable to pay its bills to other countries and the International Monetary Fund. This was a big risk; it could mean that Greece would be unable to continue to use the Euro as their currency, and could even be removed from the European Free Trade Zone, if the European Union decided the violations were serious enough.
These threats were so strong that Tsipras, despite all rhetoric, did agree to creditor demands last week, and Greece will enact the austerity reforms necessary to continue to use the Euro. This is far from the end of Greece’s financial and economic problems, but it does keep the door open for more European investment, loans, and support.
China’s stock crash and Greece’s debt crunch have been dominating news in the last couple of weeks, but these two stories have been making large waves, it seems, because they are the global outliers, not the norm.
Thanks to increasing domestic demand, and continued support from central banks, economies around the developed world have been picking up steam at a strong rate over the last year, and top analysts expect them to continue to do so. This growth is driven, in large part, by increases in domestic demand; producers and consumers at home have been demanding more goods and services, which in turn has driven increases in output and employment as firms seek to fill all the increasing orders.
So what keeps the Greek and Chinese problems from spreading everywhere else, when the banking crisis from 2008 spiraled out to affect almost everyone? The simple answer is that the parts of the economies affected by these crises are fairly separate, so it is very hard to spread outwards. Chinese stocks may have lost a lot of value, but they only account for around 20% of household wealth, and even less of corporate wealth, in China. Outside China, the percentage is even less, due to capital controls China has historically used to prevent foreign companies from taking too much control of Chinese firms.
Compare this to the Banking Crisis in the US, Iceland, UK, and many other Western European countries in 2008: most of the “wealth” held by many individuals has historically been tied up in housing, so when housing prices crashed, the wealth and savings of a very high percentage of the population was slashed. Banks themselves also had much of their equity tied up in home loans, which drove them into dire straights as value dropped, which caused the crash to start snowballing into a global problem.
The head-and-shoulders pattern is one of the most popular chart patterns in technical analysis. It’s popularity is mainly attributed to the fact that it easy easier to spot than other patterns. It’s name comes from what the pattern looks like: A head and two shoulders (and a neckline).
The pattern indicates a reversal is likely to happen after the pattern has been completed. The head and shoulders pattern comes in two forms, top and bottom. The bottom head and shoulders pattern is very similar to the double bottom pattern or triple bottom pattern and are similar in many ways.
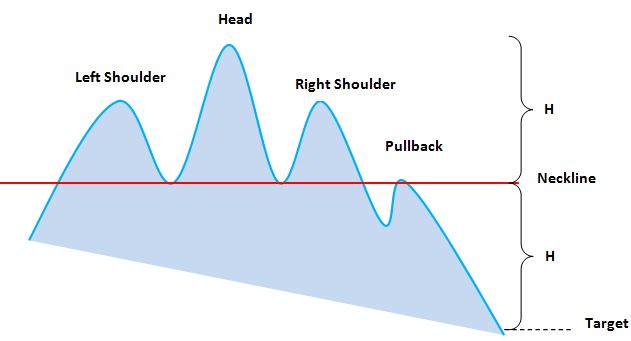
If we look at a graphical representation of the Top Head and Shoulder Pattern we can see that the pattern is composed of two shoulders, a head, and a neckline:
The pattern does not need to look exactly like this, but it does need to follow a couple guidelines:
The pattern must start with an upward trend and have a head that is higher than the two shoulders.
The shoulder heights should also be roughly the same height, though the troughs can be different heights (ascending troughs are more desirable, that is to say the second trough is higher than the first trough).
In this graph, H stands for height and, in general, we can set our target price (to exit the position) roughly the same height between the difference of the neckline and the top of the head. The downward trend is likely to hit the target price of the same difference H between the neckline and the target. This is a good place to put a stop loss order.
Another thing to note is that the pullback is not necessarily always part of the pattern, it only happens about half the time. It does not have to go over the neckline, (it is even preferable that it does not) and should not be there long, or pass the neckline by a large amount. Top patterns are fairly reliable and take a downward exit (past the neckline) in approximately 90% of cases.
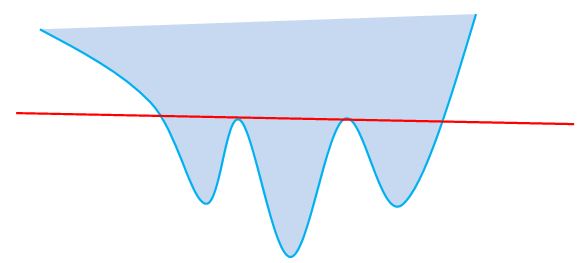
Here is also an example of a Bottom Head and shoulder without pullback.
This chart is almost identical to the Top and head shoulder and follows the same rules but inverted.
Volume:
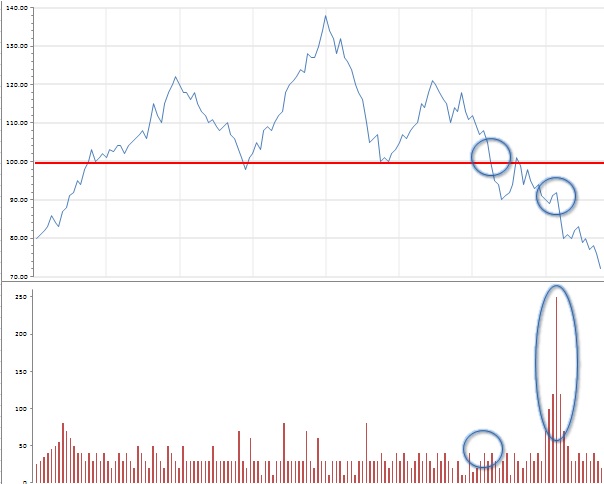
The underlying volume is a key indicator in successfully trading this pattern. Without volume the pattern is considered weak at best and is far more risky to trade.
Above, we can see that when the stock first crosses the line at the first bubble many would be tempted to trade the stock as it is fulfilling the pattern. That may have been very risky as it could simply have been a momentary decline without much strength. The far safer and more important time to trade is when the stock continues with it’s support and trades down with significant volume. This is a far stronger indication of trend.
To summarize, head and shoulders are one of the first patterns students learn in technical analysis. It is important to not only look at the pattern but to have a strong volume when breaking through the neckline or various supports and resistances.
If you follow our news stories at the top of the page, you may have noticed that a lot of the unemployment stories we focus on are generally good; US jobless claims have been falling drastically over the last 6 months, US overall unemployment rate is the lowest it has been since 2008, and the job creation rates have been steadily improving to match.
However, while this is good news for the US, it is not a universally rosy picture around the world. Developed countries with still-weak economies, like Spain and Greece, are still strugging with unemployment reaching as high as 20%. Even stronger countries are struggling with high numbers of “Long-Term” unemployed; people who may have lost their jobs years ago, have never been able to find work, and simply stopped looking. If you are not actively looking for work, you are not counted as unemployed, which makes the reported numbers lower.
If you want more information on US unemployment, employment, and job creation, check out the Bureau of Labor Statistics, which keeps all labor records for the US. If you are looking for data from around the world, the World Bank collects data from almost every country in the world, and keeps it in one place to make everything easy to find.
On Wednesday, the DOW fell over 150 points in the morning, in large part due to investor confidence being severely shaken by the massive selloff in China, and the aftershocks of the Greek referendum.
Investors around the world are reeling form these two combo-shocks, we have talked about some of the causes of the Chinese crash Here, but CNN has also published a brief explanation Here
As for the Greek crisis, the causes and future path are a wide path of economic issues, the Wall Street Journal has done a good job of putting together a point-by-point summary here for anyone who needs a primer on what went, and continues to go, wrong.
In a landslide, the Greek voters rejected the terms of the European Union bailout package on July 5th, 2015. The vote was whether or not to accept the terms laid out by European creditors, namely France and Germany, to get Greek finances in order as a condition for further loans from the European Central Bank.
The conditions included, among other things, stronger austerity measures (cuts to government spending on things like pensions and social welfare entitlements), and tax increases to strengthen the Greek government’s financial positions.
The rejection of the proposal means that European lenders will no longer be extending more lines of credit to the Greek government, which is quickly running short on funds. Greek banks have already been closed for a week, as they do not have capital requirements to extend loans. Greek citizens have been limited to 60 euro per day ATM withdraws, and hoarding of 20 Euro notes has led to an overall shortage (so even ATM withdraws have become problematic).
If Greece does exit the Euro and needs to begin printing its own money to manage its debt, most analysts predict that the purchasing power of its citizens will drop between 30 and 60% overnight, as the resurrected Greek currency is quickly devalued against the Euro, and could be a catalyst to even greater financial strife in the months and years to come.
The Greek financial system was nearing the brink of collapse early Monday morning as banks were closed and capital controls have been placed over government bodies as they prepare for the last round of efforts to keep themselves in the Euro Zone.
Greece has pledged to hold a referendum on July 5th to approve the terms from the last negotiations, Germany has stated that the result of this vote will determine whether or not Greece can stay.
The West’s largest economies have all been eager to keep Greece in the Euro over the last few months, but mounting pressure over the Greek ability to repay loans has made the stance increasingly unpopular in some of Europe’s biggest economies.
The Supreme Court has voted 6-3 to uphold the Affordable Healthcare Act, commonly known as Obamacare, in a landmark decision that effectively killed the last efforts of conservative lawmakers to have the law removed.
This battle has been continuing for years; almost since Obama’s inaguration speech lawmakers on both sides of the isle have been arguing about the next step forward for healthcare reform. Some analysts have argued that this decision may help the law makers most intent on repealing the law; deep red-state Republicans, since its repeal would hit their constituents the hardest if the current healthcare subsidies were removed.
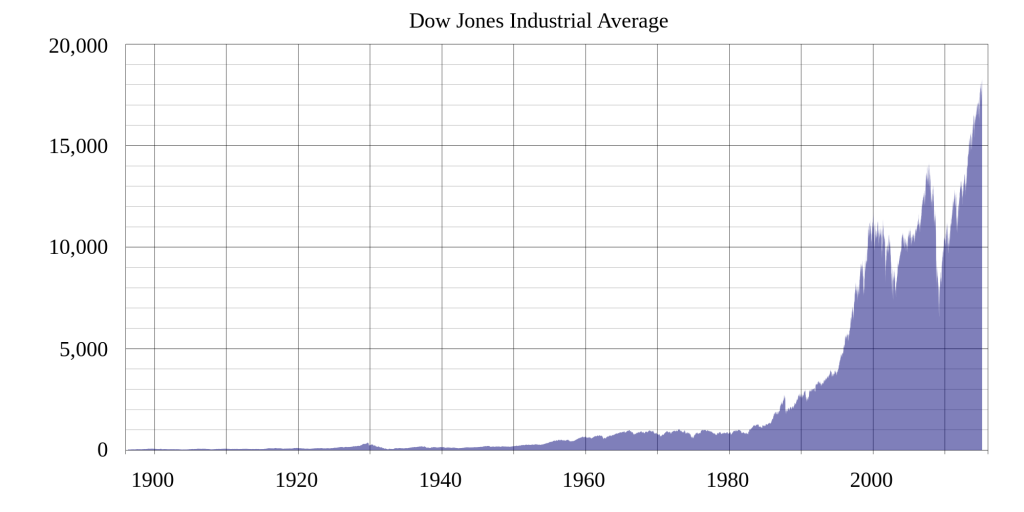
The Dow Jones Industrial Average, more frequently known as the Dow or the Dow Jones, is a stock market index made up of 30 of the largest publicly-owned companies based in the United States. It’s a price weighted index meaning that the index’s price is an average of the price of the 30 stocks that make it up. Though it’s price weighted, this does not mean that every time there is a split the index is completely changed, as they have factors to keep the value of the index consistent.
TheDow Jones Industrial Average was first calculated on May 26, 1896 by Charles Dow and one of his business associates, statistician Edward Jones. It is the second oldest U.S. market index, though the contents of the index have changed multiple times. Its purpose was as straightforward as it was revolutionary.
At the time, everyone who wanted to know how the stock market was doing had to filter through numerous newspapers, journals, and hearsay, which was a huge amount of information that was very difficult to process. Dow and Jones built the averages as a market thermometer, so a casual observer could see whether the markets as a whole were moving upwards or downwards over a given day.
The average is not a simple average of the prices of all of its components; rather it is a weighted average taking into account the differences in stock prices of all companies it tracks, and measures the change of the group as a whole. By choosing the largest and most stable companies in each of the main industrial sectors, the average acts as a stable indicator to how the markets as a whole are performing.
While there are not many companies in the Dow, it is made up of some very large, and very stable, Blue Chip Stocks. Since these businesses have proven their value over time, the ups and downs of the Dow can be a very strong indicator of investor sentiment across the entire economy.
This is an A to Z guide on the basics of using How The Market Works. We’ll cover everything you need to know about using our site and all the tools you have at your disposal. Let’s Begin!
Registration
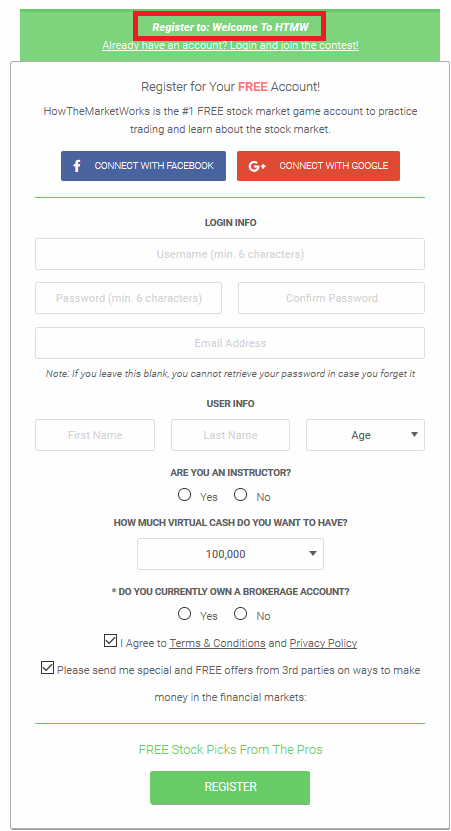
Whether you’re a student, teacher or just someone looking to learn and practice, everyone starts by registering a new account. If someone has sent you an invitation link to join their contest, the link will take you straight to the registration page. If not, then all you have to do is click “CREATE ACCOUNT” from the main menu on our homepage.
Now just scroll down and fill in all the necessary information to create your HTMW account. If you found your way here be using a contest invitation, then you’ll automatically be registered into the contest as soon as you finish creating your account. You’ll receive a confirmation email with your account details so hold onto that in case you forget anything.
Contests
Most users are joining a contest for their class or club, which is great! There are two ways to get into the contest you’re looking for:
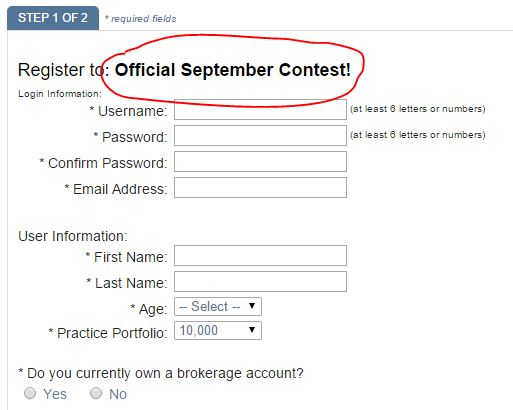
Join it directly when registeringThis is the most common way to do it, if the person who asked you to join the contest gave you a link that took you straight to the registration page, you’re already in the contest! You can tell because the registration page had the name of the contest you were joining:
Find the contest on the Contests page
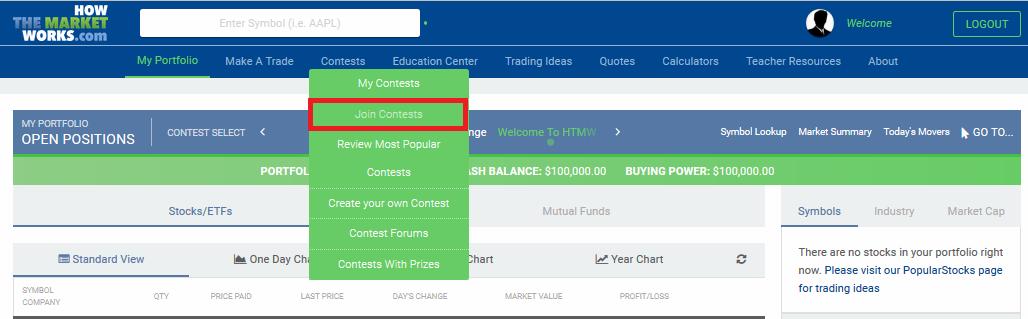
If you didn’t register directly into the contest, you can still join by using the “Join Contests” page. You can find it right in the top menu if you hover over the “Contests” tab:
From here, just search for the contest you’re looking for, or even join one of the public contests!
Active Contests
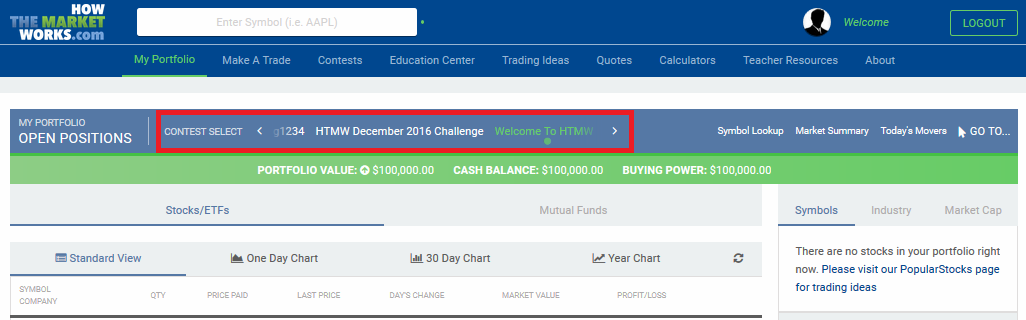
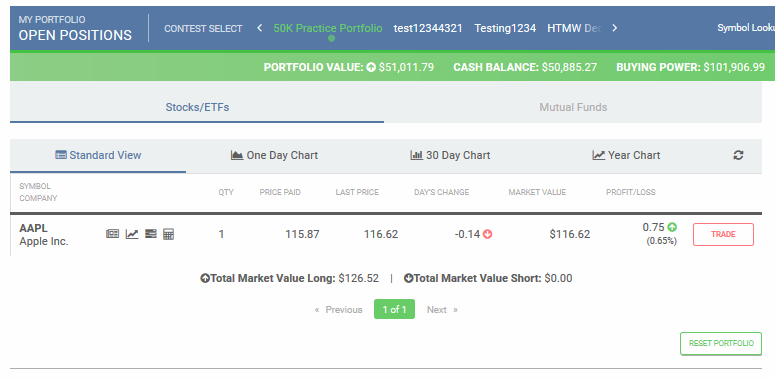
The most important thing to remember before trading or doing anything else, is setting your active contest to the right one. In almost every page is a “Contest Select” menu where you can select which contest of yours you want to view or places trades in. Here’s an example from the open positions page:
The initial default contest is your practice portfolio, however the system will save whatever contest you last set to active and make it your default the next time you log in. As long as you keep accessing the site from the same device you won’t have to worry about changing it more than once if you only have 1 contest.
From now on, you can assume that the first step in anything mentioned in this guide is to always make sure you have the right contest selected!
With that out of the way it’s time to move onto something more interesting!
How to Trade
Trading is the heart and soul of HTMW and it’s probably why you came here in the first place.
Let’s start by learning how to trade stocks.
Trading Stocks
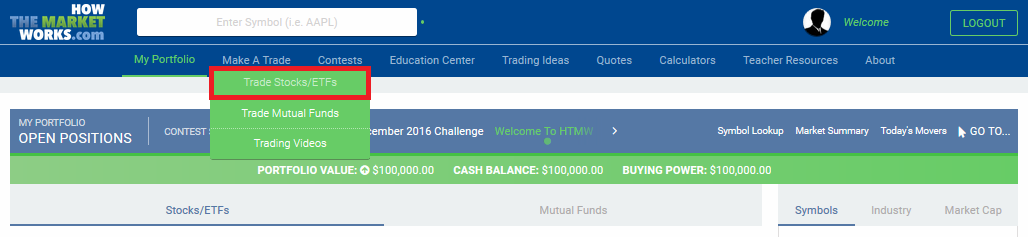
To begin, go to “Make a Trade” on the menu bar and then select “Trade Stocks/ETFs” from the sub menu, as seen below:
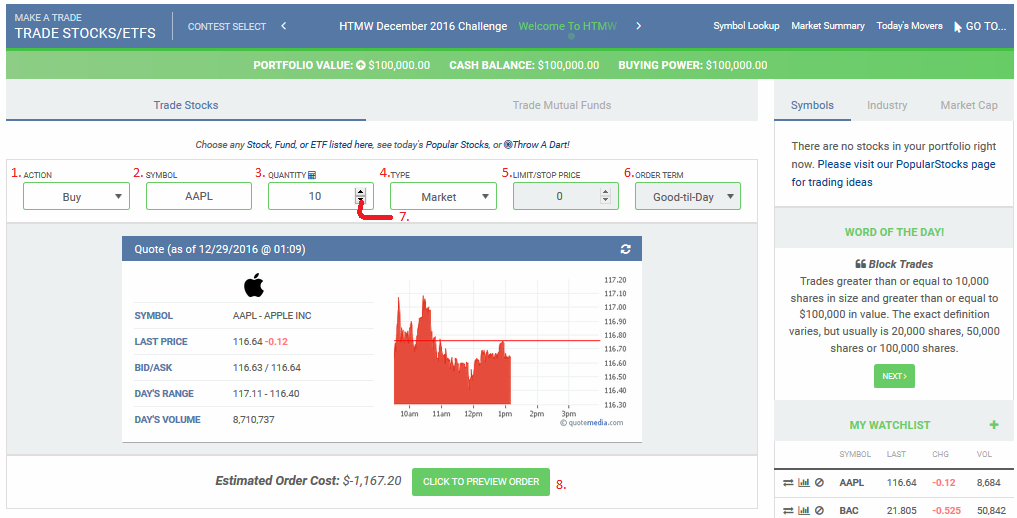
This will take you to the stock trading page where you can begin trading. We’re going to go cover what each part of the trading tool does so that you know exactly what you’re doing when making trades.
1. Action – This is where you set what kind of order you’re going to make. You can buy, sell, cover or short a stock. The default is always buy, so if you want to get rid of one of your stocks, don’t forget to change the order type of you’ll end up with even more of it! Most of your orders will probably be buying and selling, unless your a bit more advanced user.
2. Symbol – This is where you enter the symbol of the stock or ETF you wish to trade. In the above example I entered AAPL, which is the stock symbol for Apple. As you can see, once you enter the stock symbol, a quote appears telling you all the important information about the stock as well as a chart that show the stock’s movement during the current trading day.
3. Quantity – Here is where you enter how many shares you want. If you accidentally ask for more than you can afford, don’t worry! The system will stop you from accidentally going bankrupt or breaking any rules.
4. Type – This is where you set the order type. The default is always a Market order and this is what most people will use the vast majority of the time. Market orders will fill you as soon as possible at whatever the current trading price is. Limit and Stop orders allow you to set a specific price that will determine when your order fills. You can go here for more information on how the different order types work.
5. Limit/Stop Price – If you’re using a market order, as in the example above, this box will be greyed out since you don’t set a price for market orders. If you’re not using a market order, this is where you enter what you want your limit or stop order price to be.
6. Order Term – The order term is where you decide when you want open orders to expire. Market orders are always set to expire at the end of the current trading day. If you place an order while the markets are closed then your order will be come active at the start of the next trading day. If you’re using limit/stop orders then you have the option to choose “good-til-cancel” as your order term. This will keep your orders open until either your limit/stop price is hit, or you manually cancel the order.
7. Share Slider – If you’re not sure exactly how many shares you want, you can use the share slider to adjust the quantity anywhere from 1 share to the maximum you can afford. As you move the slider the system will calculate the total cost which allows you to quickly see how much you’d be spending for different quantities, instead of having to manually enter a new number for every estimate.
8. Order Preview – Once you’ve entered in all the necessary information, the order preview will give you the estimated cost of your transaction. If you like what you see, hit the “Preview Order” button and you’ll get a final confirmation request. The “Preview Order” button will change to “Confirm Order”. Now if everything looks good, hit the confirmation button and that’s it! You’ve placed your first stock order!
Now lets move on to trading Mutual Funds.
Trading Mutual Funds
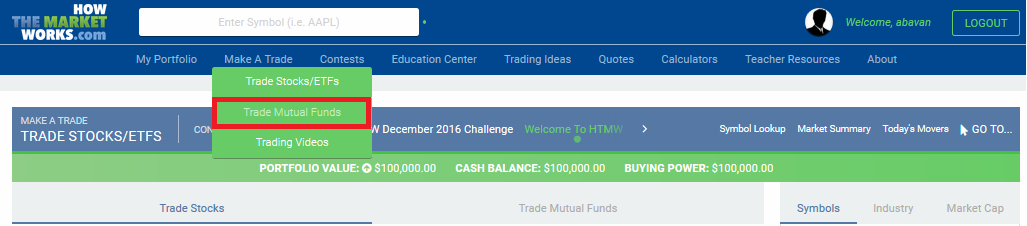
This time go to “Make a Trade” on the menu bar and then select “Trade Mutual Funds” from the sub menu, as seen below:
This will take you to the mutual fund trading page. You’ll notice it looks fairly similar to the stock trading tool, but there are a couple of key differences to note which we’ll talk about below the example image.
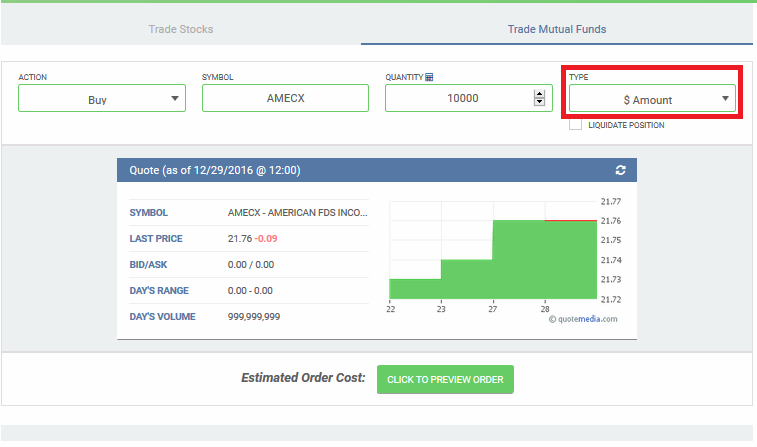
As you can see, for mutual fund orders there is only an action, symbol and quantity that need to be set. Mutual fund orders are always market orders and they are always good-til-day so there is no need for the other options.
Unlike stocks, you cannot short mutual funds, so the only available actions are buying and selling. Another important difference you need to be aware of is that by default, mutual fund order quantities are listed in dollar amounts and not units. You can change the setting by using the highlighted drop down menu shown above. Make sure you know what it’s set to as this will completely change how much you end up buying or selling. $1000 worth of a fund is usually very different from 1000 units (basically the same as shares).
Since the price of mutual funds is only settled at the end of the trading day, mutual fund orders only fill after the markets close. So don’t worry if your ordering is sitting open all day long, they will usually fill sometimes after 6pm Est.
Managing Your Portfolio
Now that you have bought a few stocks and mutual funds, its always a good idea to keep track of what you have! You already have a lot of information on your portfolio right at your fingertips.
Open Positions
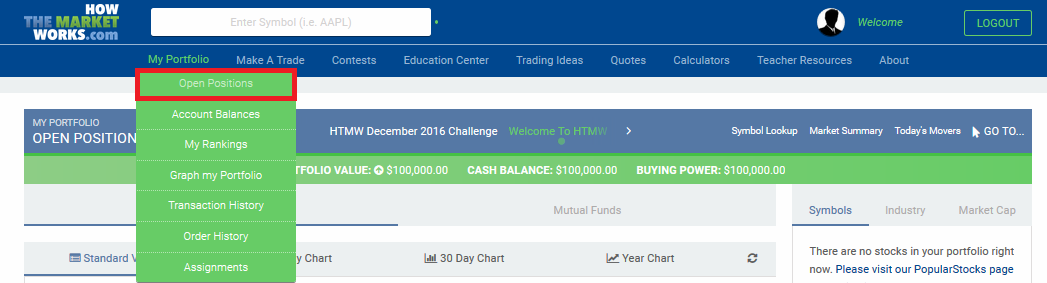
Now that you’ve started trading, you’ll no doubt want to keep track of everything you’ve bought. The easiest way to do this is to the “Open Positions” page found under the “My Portfolio” tab.
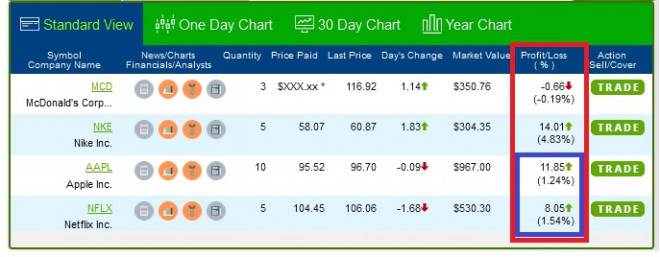
Your open positions page gives you a quick view of all the stocks you own, displaying important information such as the price you paid, what they’re worth now and how much you’ve gained or lost for each one. The “Mutual Funds” tab shows you the same information for your mutual funds if you have any.
You also have the option of seeing each position as mini one-day, 30-day or 1-year charts. The default tab is “Standard View” (found right above your list of open positions) and you can toggle between the different charts by selecting the appropriate tab.
Account Balances
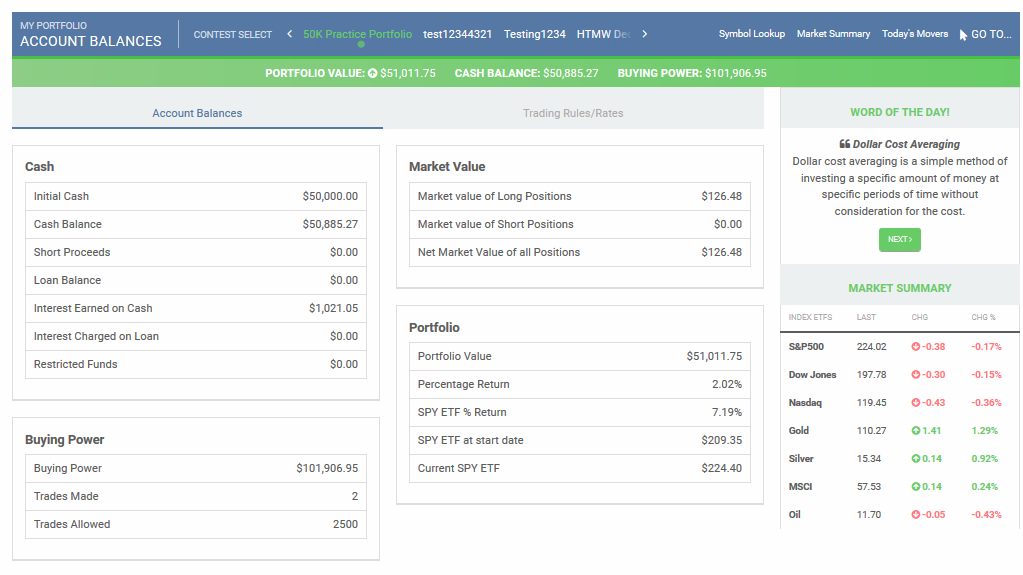
Next to the “Open Positions” tab shown above, you’ll find the “Account Balances” tab. This is where you’ll go to get more detailed data on your current portfolio. You have 2 different options here :
Account Balances:
The “Cash” section which covers your cash balances
The “Market” section provides the value of your open positions.
The “Portfolio” section which gives you information on your portfolio value, gain/loss and some other important details.
The “Buying Power” section which provides information on your buying power, the number of trades made and allowed.
Trading Rules/Rates:
This section details all the rules set by the contest’s creator such as positions limits and whether or not day trading is allowed.
Transaction History
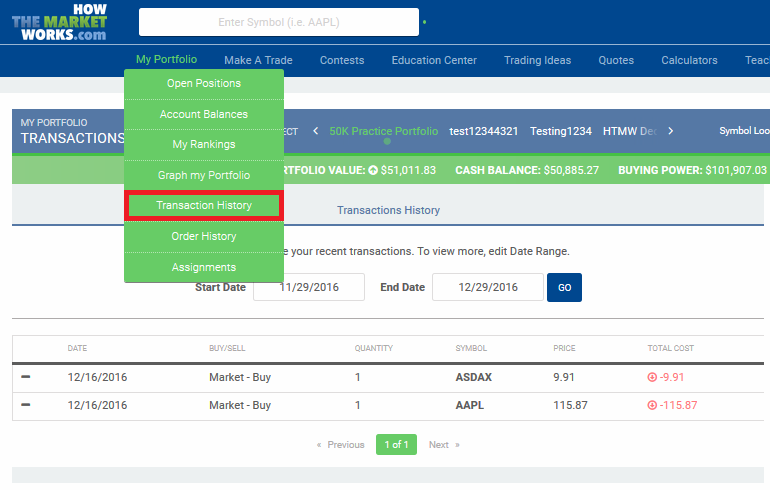
A bit farther down the menu you can find your Transaction History
This is where you can see all your orders that have executed, plus all the dividends that have been paid to your stocks. We pay out dividends on the ex-dividend date, and the whole process is automatic, so you never need to worry about missing one. We also handle all splits, and you can see those here as well.
You can change the dates that you want to look at, in case you only want this week, or several months.
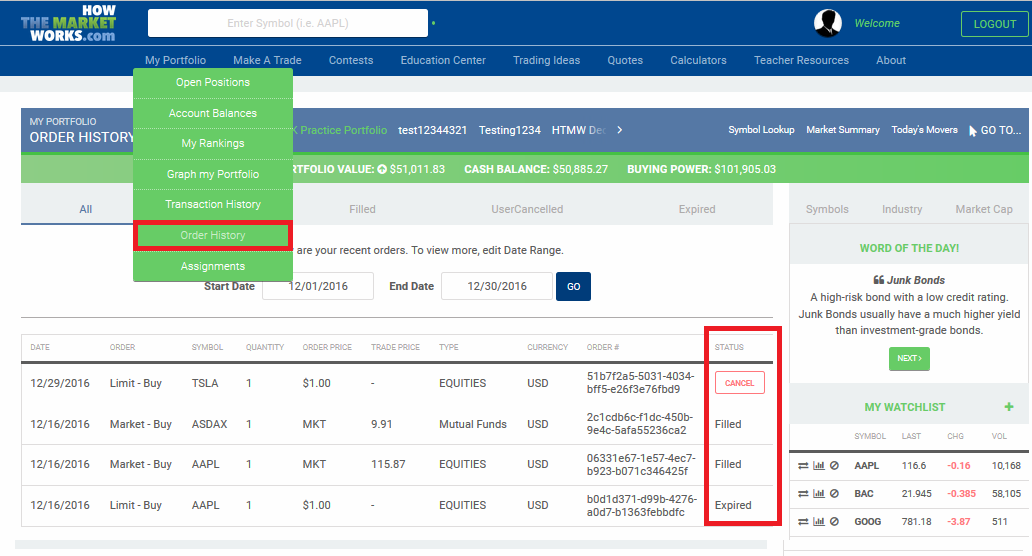
Order History
Under your Transaction History is your Order History page:
Here you can see all your orders, whether or not they have executed. For example, in the screenshot here, I have an order that has not yet executed, so I have the option to cancel it.
All orders placed after 4pm will be “pending” until the next market open, so you can always cancel them overnight. Mutual fund orders will be open until 6pm on the day you bought them, when they execute. If you placed a good-till-cancel limit order, and you want to cancel it, this is the only place to do so.
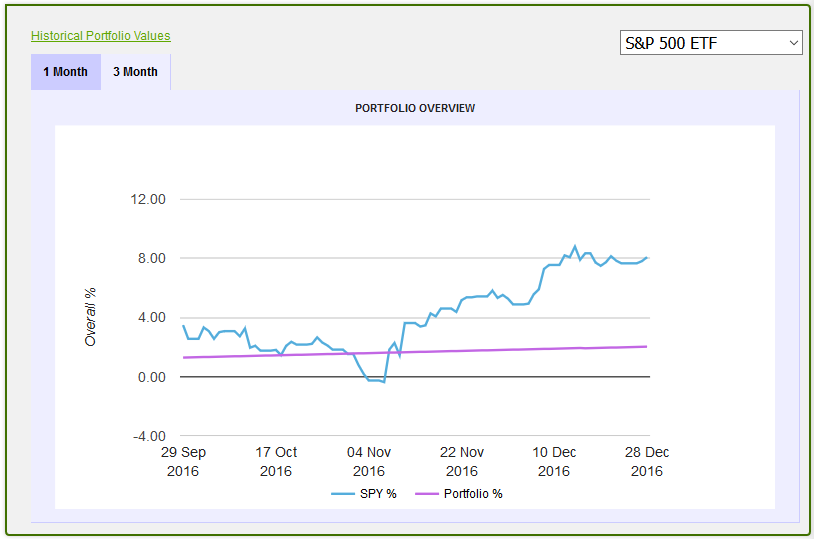
Graph My Portfolio
If you want to see your portfolio value over time, and compare it with an index like the S&P 500, or Gold, you can do so at Graph My Porfolio. You can switch between a 1 month and 3 month view.
Rankings
One of the most popular places on HowTheMarketWorks is the rankings page. There are no rankings for the official practice portfolio, but if you join a contest you can see your performance against everyone else in that contest.
Rankings are divided by Overall, Weekly, and Monthly
Trading Ideas
Not sure where to start? Don’t worry! We have tons of resources to get you started.
We have several different options under our “Trading Ideas” tab, check them all out if you’re feeling “stock” and aren’t sure what to look for. We even have an option to “Throw Darts” for completely fresh ideas (these are chosen from a list of popular stocks, and show the price and if the stock is up or down).
Quotes and Research
Doing stock research is a huge topic in and of itself, but if you want to do research, look up company info, check out the day’s market summary, and much, much more, check out the Quotes tool!
Creating A Contest
If you want to create a contest, check out our Contest FAQ section here:
The world’ biggest brewer is trying to stay at the top spot! Anheuser-Busch InBev has been the top dog for beer for the past few years, with its flagship beers in the United States, Budweiser and Bud Light, ranking as the most common across the nation.
However, “most common beer” is meaning less and less and more and more consumers have been moving to craft beers and microbrews, made by a wide range of smaller brewers, which has been very quickly eroding InBev’s total market share.
Their solution has been acquisitions, buying up some of the most popular micro-brewers in the US to satisfy the consumer demand for artisanal beers without eroding their own market dominance. Some companies, like Goose Island in Chicago and Elysian Brewing in Seattle, hesitated before the purchases but have been mostly happy moving forward. The previous owners, and master brewers, have been happy with the approach, which they claim has allowed them to reach wider markets without any pressure to compromise techniques or ingredients.
Only time will tell if this strategy of “buy up then hands off” will continue, but beer drinkers everywhere are watching carefully.
Walmart is not the only major retailer to be increasing their minimum wages for all employees; Ikea has increased their minimum wages for US workers for the second year in a row.
Both major retailers reported much lower labor turnover rates after increasing the wages. However, Ikea, unlike Walmart, offers its wage increases based off the “Cost of Living” in each of the 40 US cities where it currently operates. Walmart has a flat minimum across all locations.
Labor groups have been pushing for a universal increase to a $15/hour minimum wage across all retail and service industries, a push that has been supported by a series of very public protests by workers in several cites.
Over the past few years, student protest movements from around North America and Europe have been pressuring their universities to “divest”, or pull all their money out, from companies that make their money on fossil fuels.
The argument has always been that the multi-million dollar endowments managed by the schools should not be complacent in companies causing climate change.
Hundreds of universities have agreed with the student concerns, and have either divested from these companies, or pledged to avoid investing in them in the future. The students have celebrated their great victory.
However, current research shows that many of the schools who have made these pledges held so little equity in these companies to begin with (often none at all), that the divestment pledges account for somewhere between little and no action on the part of the universities making them.
Apple Inc (AAPL) announced that they were launching a new music streaming service to compete with the likes of Spotify. The service will have a cost, but Apple was happy to announce that there will be a 3-month free trial period for all users.
This sounded great for users, but they also announced that no royalty payments would be made to artists for songs streamed during this trial period. The pop superstar Taylor Swift took issue with this stance, and announced that she would not be allowing her top-charting album, “1989”, to be streamed on the service in protest. She claims this is not about her own music, but in support of all the new artists releasing their first albums, and being denied their vital royalty payments.
Apple was quick to back down, announcing on the morning of June 22, 2015 that they are reversing their policy, and will be paying all artists for all streams, including those made while on the trial period. It took less than 24 hours after Swift’s announcement for this reversal to take place.
Friday, June 19 2015 was a very rough day for investors in China, over the last week the Shanghai composite index has fallen more than 13%.
Analysts at three major investment and analyst firms across the United States have been issuing “Bubble Alerts”, warning that many Chinese stocks are dangerously over-valued, and the Chinese stock market may on the brink of crisis. The median Chinese stock is currently valued at 95 times earnings, compared with an average of 18 times earnings with companies listed on US exchanges.
Read more about the Chinese bubble here: http://www.bloomberg.com/news/articles/2015-06-19/china-stocks-enter-correction-as-blackrock-sees-bubble-bursting
The first set of contests that were created on our new site are starting to come to an end, so this batch of new features is built for you!
From this point forward, once your contest ends, you can come back to your Open Positions page and look up your final values at any time. The Rankings page will also save your final values and your final rank, along with a new feature that lets you look at the rankings from any previous day in the contest.
We have also tweaked the rankings slightly – now users who have not placed any trades will not appear in your contest ranking, and if a user does not log in for 30 days, they will drop to the bottom of the list (showing a rank of 9999). This was put in place because we have had many requests for “inactive” portfolios to drop out of the rankings, both from public contests and classrooms where teachers do not want inactive students to feel like they are outperforming students who are constantly working to improve their portfolio.
We have also made tons of changes to the Education Center! The entire Education Center is now mobile-optimized, so you can see any of our articles on the go. We have also re-written many articles from scratch to make them more appropriate for our audience and dive in to a lot more detail. You can also now find some great interactive personal finance calculators, such as:
As a heads-up, we will be moving the new version of the site to the address www.howthemarketworks.com over the Summer. If you have an account or portfolio on the old version, you won’t lose it, but you will need to change the address you use to log in.
As always, there have been tons of small changes and bug fixes every week, this only outlines the biggest additions we make to the site. Happy trading!
Most investors are familiar with NASDAQ, the NYSE (New York Stock Exchange), TSX (Toronto Stock Exchange), and most other large national stock exchanges. However, there are also thousands of companies that want to sell shares to the general public, but are not able to sell on these exchanges. Stock traded on these “Over The Counter” exchanges are known as OTC stocks.
Why do companies trade OTC?
Major stock exchanges have very specific rules about being listed, along with specific costs involved to stay listed once originally posted. Some of these reasons include:
Minimum Stock Price
Earnings must be above a certain threshold ($11 million per year for the 3 consecutive years for NASDAQ, for example)
Cash flow and Market Capitalization minimums
Corporate filing requirements
If a smaller company wants to list its stock for sale to the public, they can offer their stock on OTC exchanges to avoid some of these restrictions. Medium companies that shrink, and no longer maintain the minimum requirements, can also be “de-listed” from a major exchange and have its shares continue trading on OTC exchanges as well.
What is required for a company’s stock to trade OTC?
While the minimum market capitalization, revenue, and cash flow requirements are not an issue for OTC stocks, they ARE required to make similar SEC filings to be listed. These include financial statements and information on the company management.
What is the main drawback of trading OTC stocks?
OTC stocks are often very small companies with very small market capitalization. This means that they often have extremely low, or even zero, annual revenue or assets, making them extremely risky investments. “Penny Stocks” exclusively trade on OTC markets, and are often the vehicle for stock fraud schemes, including “Pump and Dump”, where a individual for firm buys a large amount of stock, starts a marketing campaign to convince other investors that stock is set to rapidly gain value, and then dump their stock, leaving other investors with worthless stock that had its price inflated by hype.
OTC stocks also have a major drawback in that they are very, very thinly traded (often less than 100 shares per day). This means that the bid/ask spread is very high, making the “last price” hours, days, or even weeks old, since it so rarely actually trades between investors. This means once an investor purchases the stock, it can be extremely difficult to actually sell it, since there may not be anyone willing to buy it from you.
Are there any advantages to OTC stocks?
There can be very good reasons to buy OTC stocks as well. For example, some very small start-up companies will sell their first set of shares on OTC, and as they grow eventually be listed on NASDAQ or another major exchange. The investors who found and invested while it was still a micro-cap potentially could make very high rewards. For example, in 2015 InVivo Therapeutics (NVIV), a medical technologies company, was listed on OTC before it was able to be listed on NASDAQ. In April 2015, they officially transitioned to the NASDAQ, with their OTC shares becoming NASDAQ shares, and its investors seeing a large gain in value as more investors were made aware of, and became interested, investing.
There are also other advantages: foreign companies may not be willing to list a large number of shares on a large national exchange, but a small number of shares may be traded on OTC exchanges. For example, Nintendo and Heinekin, which trade on the Japanese and Dutch exchanges respectively, have a small number of shares that trade in the US on OTC markets (as NTDOFTO and HKHHF respectively). The price on the OTC markets generally matches the price on their own domestic markets, although there is often a much larger bid/ask spread due to lower volume, and price differences stemming from currency conversion.


