“Asset Allocation” is how you have divided up your investments across different assets. You can have all your assets in one place, or you can use diversification to spread them around to reduce risk.
Details
Whenever you pick stocks, open a bank account, get paid, buy something, or do anything with any resources, you are doing some form of “Asset Allocation”. Early on, the choice is simply “Spend” or “Save”, how you are using your money. But like most things with investment, it is never that simple.
For example, once you have chosen to “spend” or “save” a dollar, you have another choice to make:
If I spend it, do I buy a video game or go out to the movies?
If I save, do I put it in a savings account or hold it as cash?
For us, we care mostly about savings. So if you save $1000, you can save it as cash, put it in a savings account, or invest it.
If you put it in a savings account, there are different kinds of savings accounts that may give you a higher interest rate, but limit how much you can withdraw.
If you invest it, you can divide your investment between stocks, bonds, mutual funds, or ETFs
If you invest in any stock, bond, mutual fund, or ETF, you will need to decide which specific ones to invest in
Of course, at every level you also have a choice of splitting your money and doing one thing with part, and something else with another. With your $1000, you can spend $300, hold $100 as cash, put $200 in a savings account, use $150 to buy Johnson and Johnson (JNJ) stocks, and invest the last $250 in mutual funds. That is a lot of choices to make, even with one small block of assets!
Choosing How To Allocate Your Assets
Every time you allocate your assets, you are making many choices at once
When Spending
When you spend your assets, your main decision is Opportunity Cost. If you spend your money on one thing, you cannot spend it on another, so you need to make sure you are buying whatever it is that will give you the most benefit. You are also choosing not to save or invest, which means the benefit you get from buying something today should outweigh the benefit of having that extra investment return in the future.
When Investing
When you invest, your asset allocation will be based on 4 main criteria:
Risk: Sometimes taking bigger risks can give bigger rewards, but you still have the chance of losing big too. How much risk you can tolerate will dictate a lot of your asset allocation.
Liquidity: How much do you want the freedom to move your money? Assets that you can quickly convert back to cash are said to be very “liquid”, while assets that are very difficult to convert to cash (like houses) are “illiquid”. How much you value being able to move your asset allocation over time will also dictate what kinds of things you invest in
How much you have: You can only buy a house if you have the ability to pay for it, and that goes with most other investments as well. If you do not have the assets necessary for a minimum investment, some options may be not open to you. This is becoming less and less of an issue with stocks, bonds, mutual funds, and ETFs, however.
Opportunity Cost: This is the same as with Spending; whatever you invest in one asset is money you cannot use to buy something or invest in something else.
When you balance these four criteria, you will start coming up with your asset allocation. Just because you value one more than the others does not mean all your assets will go to one place either; a person who values liquidity the most probably will not keep all their assets as cash, both because it is risky (cash can be easily lost or stolen), but also because there is only so much cash you need at one time, so you can hold lots of cash but still keep some invested.
Asset allocation is the basis for risk management, building a portfolio, and diversification
New data shows that housing starts hit an 8-year high in July, with a construction frenzy underway as the housing market continues on its recovery after the financial crash.
Home remodeling activity has been up as well, which helped Home Depot (HD.N) beat earnings estimates and see stock prices reach new heights. There have been other spill-over effects as well; the construction boom has helped lower the unemployment rate as construction firms increase hiring to meet demand, and all this building has driven the need for new trucks, new tools, and other light and medium industrial goods from companies like General Motors (GM) and Ford (F).
There may be some dark clouds on the horizon however; the number of new building permits, which usually signals construction that is to begin fairly soon, hit a sharp decline. This may be partially due to the end of the summer, but the numbers are down even when seasonally-adjusting.
The world markets are still edgy after China’s currency devaluation last week, and a Fed report showing that New York area manufacturing started sliding downwards has not put any investors at ease.
Commodities and stocks both started down on Monday morning, many top analysts predict the pullback will continue for a short while longer as investors “feel out” what all the fallout from these big events will be. The fall in manufacturing is not especially unexpected, but as bad news piles up it makes investors start looking for safe havens for their money.
Traditionally, there have been two “havens” to go; bonds and gold. Gold, however, continues to decline along with many other commodities (especially oil) in a long-term downward trend. This leaves bonds, which have seen demand spike, and thus yields plummet, over the last few days as investors pour money in. It would not take much to have the market start swinging the other way, so pay close attention to the current market news to know where market sentiment is heading!
StockLinkU, the stock simulation site launched in 2012 from Greenville SC, has apparently shut down.
StockLinkU has apparently closed its virtual trading site. The site has been unavailable for several months now and there are no comments from its facebook and linkedin pages. Launched in 2012 as a free site, the site struggled to gain an audience or establish a niche. StockLinkU was originally a free site, then changed its model to a pay site, and now has apparently disappeared and gone under.
Former StockLinkU users are encouraged to explore the other leading stock simulation and virtual trading sites:
StockTrak Global Portfolio Simulations: Stock-Trak, now in its 25 year, is without a doubt the leading virtual trading site for university Investments, Portfolio Simulation, Derivatives, and Personal Finance classes. StockTrak allows professors to create a custom virtual trading contest for their class by selecting the trading dates, initial cash balance, and other parameters. Students then register into that contest and compete against their fellow classmates trading stocks, bonds, mutual funds, options, futures, and forex from over 50 global exchanges.
HowTheMarketWorks.com: HowTheMarketWorks, launched in 2004, is a FREE alternative, similar to StockTrak, except students are only allowed to trade U.S. stocks, mutual funds, and ETFs. HowTheMarketWorks was used by over 350,000 users and in 10,000 classes and clubs in the last 12 months.
If you are looking for an alternative to StockLinkU, either of these sites will work and they will be around many years from now.
The European Union economy was expected to grow by about 0.4% in the 2nd quarter of this year, but researches have determined it missed the mark, coming up only at 0.3%.
This may not sound like a big miss, but that tenth of a percent is a lot of money (billions of Euros of unrealized growth) that has many investors worried. The main reason for the miss was a slowing in the 3 biggest economies: France, Germany, and Italy.
France in particular was estimated to grow by 0.2%, but actually just broke even; Germany expected 0.5% and came in only at 0.4%.
The union has been rocked by the Greek debt crisis; while Greece accounts for only a very small percentage of the entire Euro area’s economy, the gloomy news has been dominating the headlines and dragging down investor confidence. In fact, Greece has expanded more than analysts had hoped, but researches have yet to find a way to figure in the capital controls in July into their results, and the Greek stock crash is sure to weigh down results for the next quarter.
The beginning of the week was dominated by the Chinese currency devaluation; the Chinese central bank devalued the Yuan by over 4% from Monday’s exchange rate with the US dollar over the week. However, by this morning, things have returned more-or-less to “normal” on international currency markets.
The biggest fear when the devaluation was announced was the possibility of a “currency war”; where countries try to repeatedly de-value their currencies against each other to help boost exports their own exports. One of the immediate results from a threat of a currency war is that investors try to “flee” volatile assets like stocks to “haven” securities like bonds and gold. This makes the demand for stocks fall (and so stock prices tend to do down), while the demand for gold and bonds goes up (and the prices with it).
Thursday saw calmer markets as fewer investors were fearing a currency war; bond and gold prices dropped back to previous levels and stock prices also began their recovery.
An investment strategy is the set of rules and behaviors that you can adopt to reach your financial and investing goals. Choosing an investing strategy can be a daunting task when you are starting to learn about investments and finance. Here we will look at the larger overall strategies rather than very specific strategies.
Given that this is such a broad term there can be strategies that go from the top (Overall Portfolio Strategies) to the bottom (stock-picking strategies). You can decide on a strategy starting with an overall strategy and then select more specific strategies (top – down approach) or similarly you can look at a specific strategy and select the overall strategy that goes with (bottom – up approach).
What’s important to note is that a strategy can incorporate multiple strategies, practices and tools. Doing one strategy does not always mean that another strategy cannot be used in conjunction. What’s most important is finding your own strategy and familiarizing yourself with all the different strategies and financial tools that are available so that you can make a decision that is well suited for you.
Picking a Strategy
Strategies
Given the huge number of strategies and variations within strategies we are only going to review common strategies. The level of risk for most is highly dependent on the type of investments made, rather than the strategy itself. The most popular strategy that is used by most investors that would go to a bank or an investment firm, for example, is a mix of diversification and asset allocation.
Random picks: Picking a large amount of random stocks has been found, on average, to be more successful than the vast majority of trading strategies.
Follow: Involves following whatever stock is “hot” at the time.
Buy and hold: Involves simply buying stocks and holding them for a longer period of time.
Day trading: Considered to be fairly risky trading strategy of buy and selling many times in one day to take advantage of fluctuations in the market.
Contrarian: Involves doing the opposite of the current market sentiment. Buying when everyone is selling and selling when everyone is buying.
Cyclic: Involves trying to time market ups and downs and trading accordingly, usually done with technical analysis.
Technical: Using Technical analysis to make decisions.
Fundamental: Using Fundamental analysis to make decisions.
Income: Finding assets that give income on a regular basis (such as dividends)
Growth: Finding assets that will have high potential growth but little current income.
Diversification: Choosing a large number of stocks or assets to reduce risk.
Asset Allocation: More of a guideline than a strategy, that can help with determining the correct amount of investment in each asset type.
As we’ve seen, even a buy and hold strategy can be incredibly complex depending on the specific strategy you use and the level of analysis made. What’s important is to tailor your strategy with what you are trying to accomplish. Someone who needs money right away but is risk seeking and has a great deal of knowledge may consider day trading to be a very viable option. Similarly, someone who has decades to invest and moderate risk aversion may still want to try his hand at day trading.
Passive Vs Active
Overall Strategies can also be broken up into passive and active categories:
Passive strategies are just that, passive. After making the initial decision to purchase a stock, investment, etc. the passive investor will keep it for months or years without making large changes. An example of this is someone like warren buffet who generally holds stocks for long periods of times and does not make changes to his holdings very often.
The active trader, however, will trade multiple times a week or even per day and will constantly evaluate what he is doing. Day traders are the most obvious example of an active trader.
It’s important to note that passive and active trading is over a spectrum, so someone who makes a few adjustments to their portfolio a few times a week could still be considered passive depending on the size of his portfolio for example.
Liquidity, Risk, and Potential Returns
All investments balance liquidity, risk, and potential returns. The balance among these three areas depends on your own individual taste, but how you view them will determine what kinds of investments you choose.
Liquidity: Liquidity refers to how easily and quickly an asset can be converted into cash without losing its value.High liquiditymeans that the asset can be sold quickly at a fair price, whereas assets with low liquiditymight take longer to sell or might require a discount to attract buyers.
Risk: In the context of investments, risk refers to the degree of uncertainty about the possible outcome. High-risk investments have a greater chance of losing money, but they may also offer higher potential returns. Low-risk investments are generally more stable and reliable, but they tend to offer lower returns.
Potential returns: Potential returns are the possible profits or gains an investor could earn from an investment. Investments with higher potential returns are usually associated with greater risk, as there’s more uncertainty about whether the investment will actually result in a profit. Conversely, investments with lower potential returns are typically less risky but also have limited profit potential.
Don’t Keep All Your Eggs in One Basket
Diversifying your investments is crucial at various levels, not just between asset classes, but also across sectors. Start by allocating your assets among different security types. For instance, a classic approach involves investing 50% of your savings in real estate, while the remaining 50% is divided between stocks and bonds. This way, if housing prices decline, your investments in stocks and bonds can provide some protection. Similarly, if the stock market falls, your real estate and bonds could help stabilize your portfolio.
Bonds are generally safer investments since their value is tied to prevailing interest rates, making them less susceptible to market fluctuations. They can also be beneficial during a rise in housing prices, stock prices, and interest rates, further reinforcing the importance of diversification.
Use an Evolving Portfolio
The traditional advice to invest in “more bonds as you get older” stems from the belief that your portfolio should become more conservative as you approach retirement. The idea is to minimize risk with your money as you near retirement age. If your stocks lose value when you’re 25, you have around 40 years to recover the losses before retiring. However, if your stocks decline in value when you’re 62, it’s much more challenging to compensate for the lost income, emphasizing the need for a lower-risk investment strategy in later years.
Alibaba (BABA) missed its earning target, driving shares farther down for the company that had the world’s largest IPO last year.
The news of the Chinese commerce behemoth’s miss came just after China announced another round of currency devaluation, bringing the total drop of the Yuan to almost 4% compared to last week against the US dollar.
Alibaba stock has been on a roller coaster since inception, the tumble after this earnings announcement brings it down to just 40% of its all-time high. Managment has been unfazed, however, with the CEO Daniel Zhang commenting, “We had a strong quarter and we continued to build the foundations for future growth. We focused our efforts on building healthy GMV growth, delivering the best consumer experience, and improving the quality and sustainability of merchants doing business on our marketplaces. “We are excited about our top strategic priorities, including internationalization, winning in mobile, expanding our ecosystem from cities to villages, and investing in core technologies that will propel our cloud computing business.”
The earnings miss was not all bad news, so his upbeat tone is not unwarrented; its revenue was $3.16 billion versus an expected 3.28, and business great at 34%, which is the slowest of the last few years but not too shabby by any metric.
Tuesday morning China announced an immediate 1.9% devaluation of the Yuan, surpising investors and economists around the world. Bankers around the world have long criticized China for manipulating its currency value in order to help drive exports; this sudden devaluation only strengthens those concerns.
The Chinese economy has been facing slowed growth over the last few months, which has been exaserbated by signs that the Chinese stock bubble is finally bursting, with huge losses across the board.
The reason that the devaulation is a bid deal is because China historically has set the exchange rates between the Yuan and other major currencies, dictating how much their currency is “worth”. If a single US dollar can buy 2% more Chinese Yuan today than it could yesterday, it means that Chinese exports just got 2% “Cheaper” to everyone else in the world, and at the same time imports become more expenses.
Analysts believe the Chinese central bankers are using this to their advantage; by making exports cheaper they hope to continue to drive industrial output destined for other countries, while making imports more expensive would help increase domestic domand for Chinese-made goods by making imported substitutes less attractive.
Volume-Weighted Average Price (VWAP) is often used as a trading benchmark by traders, pension funds, mutual funds and market makers. It can allow traders to get a sense of how successful they were in obtaining a good price. A buy order filled below the VWAP would be considered a good trade.
Using VWAP
A lot of people will wonder why not just use the average price, it’s a lot easier to calculate and isn’t it essentially the same thing anyway? As we can see, the difference is that it tracks volume as well. By tracking volume you also get information about liquidity as well as the amount of money that traded, not just the price.
Calculation
VWAP calculation can vary greatly depending on the time frame and time horizon you choose, as well as the price calculation. However, VWAP is typically used within one trading day and uses a one minute time frame.
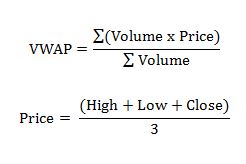
The formula for VWAP is:
The price can be used as the last price in a time frame or the price calculated using the high, low and close in a given time frame. Here is an example of the calculations:
Volume
Price
Price * Vol
Time
VWAP 1 min
20
10.15
10.15*20 = 203
9:30
203/20=10.150
30
10.21
10.21*30 = 306.3
9:31
(203+306.3)/(20+30)=10.186
75
10.22
75*10.22 = 766.5
9:32
(203+306.3+766.5)/(20+30+75)=10.206
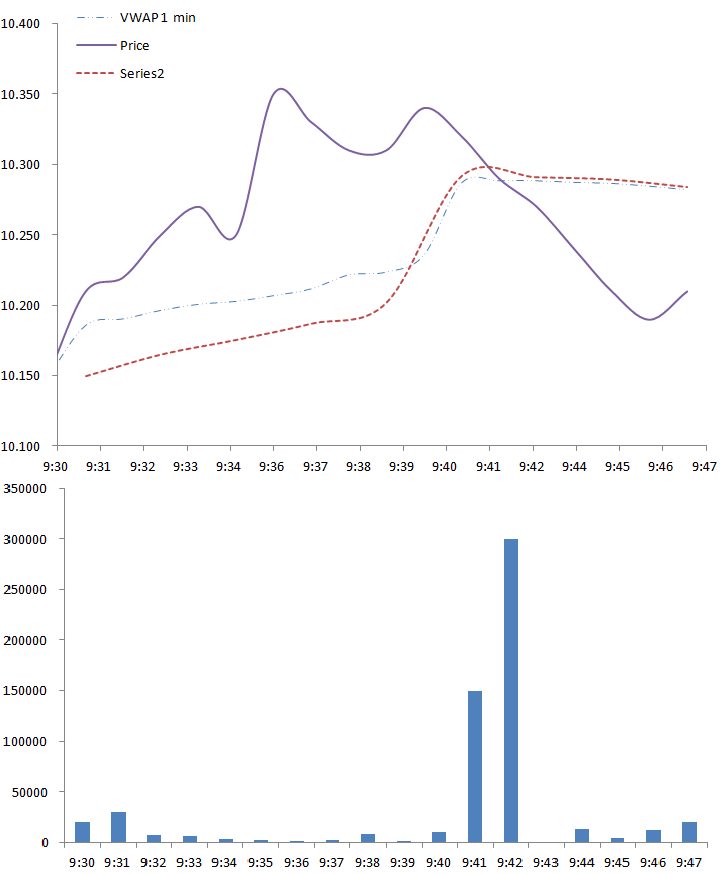
We can see from the calculations that the VWAP is cumulative and thus a price at the beginning with high volume will have more effect than a price at the end of the day, since it is now just a drop in all the trades placed over the day. It would take a very large volume and/or price change to change the VWAP at the end of the day (depending on the time frame you use). Another important thing to notice is the time frame, a smaller time frame (such as every trade or tick) will be more accurate, but for a stock that trades a lot this could be data for 50,000 trades. If you are doing multiple stocks, this could easily slow down or even crash your computer if you started storing and calculating enough days.
Graph
The greatest change in the results and calculation of VWAP is the time frame. If we look at the difference below between a 1 minute time frame and a two minute minute time frame we will see there is a discrepancy.
As we can see the two minute does not follow as closely as the 1 minute since it is only “checking” the price every two minutes.
Another ratio we can use similar to VWAP is the moving VWAP (MVWAP) that is similar to a simple moving average. This will use a different period and will sometimes be carried over from day to day depending on the period used. Essentially, instead of starting at one day, we will calculate our MVWAP using the data over the period we wish to study. For example, we can say we wish to take a period of 10 minutes and thus we will essentially have a VWAP that started it’s “day” ten minutes before.
Oil Futures are down again this Monday morning after the newest reports show that the US has deployed 6 more drilling platforms, while OPEC continues record output.
Countries who rely on oil exports for a significant amount of tax revenue have been pummelled; Canada is struggling to keep its promise of a balanced budget, Norway is calling $50 “Worse than the global financial crisis“, Russia is slashing social programs to make up the shortfall, and OPEC countries have been burning through cash reseserves at a record rate.
However, even with all the doom and gloom, no one is looking to start cutting back supply, even as global demand looks to be weakening with the end of the Summer. OPEC is scheduled to meet in December, but many members are already pushing for an earlier meeting to discuss pulling back to raise prices.
The United States is also not immune; oil producers make up a large share of the energy sector, which historically has been one of several pillars retirement accounts have rested on. Weakening oil could mean bad news for millions of pensioners, depending on how nimble their money managers have been at addressing the price collapse.
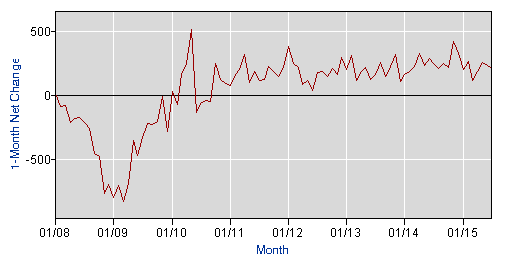
Based on the latest reports from the US Department of Labor, over 215,000 jobs were added in July, following a 230,000 increase in June. Despite the gloom-and-doom in the commodities market (especially oil and gold), hiring across the entire economy has been growing at a fairly stable pace over the last 5 years as the overall economy continues to grow.
The continued strong hiring numbers indicates that companies expect the growth to continue; companies only hire more workers when they estimate continued increases in demand, and the bright future outlook is good both for companies and workers looking to earn more.
The increase in payroll employment was not matched with a decrease in unemployment, however (the unemployment rate remains at 5.3%, unchanged from June). This can mean one of two things: either people who were previously not looking for a job have now started looking because they think prospects are better, or people who were already working part-time or for very low wages have “upsold” into better jobs with higher salaries. Either way, it is good news for the average American worker.
We know that there are tens of thousands of teachers who use HowTheMarketWorks in their classroom every year to teach math, social studies, personal finance, and business, so we’ve added some great new features just for you. We call them “Assignments“, and they will make teaching about the stock market a breeze!
Here’s how it works: After you create your class contest, click on “Manage Assignments”. This will let you create a new assignment, delete an assignment you’ve already created, or see the progress of all your students on assignments that are already in place.
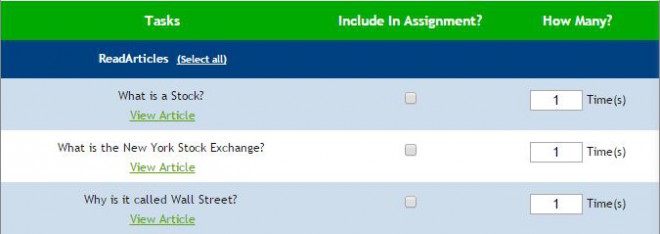
Assignments are a group of tasks that appear for everyone in your class contest. These include tutorials to help get started, like watching our tutorial videos, placing different types of trades, reading some of our articles for beginners, and using our personal finance calculators to solve a series of challenges.
The current beginners articles you can include are:
At the end of each article or calculator, there will be a short (3 to 5 question) quiz on the content of the article or questions that can be solved using the calculator. Once your student can get all the questions right, their assignment will be marked as “Complete”! Students can re-take the quizzes as often as they like until they get full credit.
Your students will also have a progress bar on their Open Positions page showing their current assignment progress, along with the next list of tasks they need to complete. When we did a demo of the assignments for some teachers, we can already tell it will be a hit, so check it out today!
In a game of Tit-For-Tat, Russia banned imports of most food from Western Europe last year after Europe imposed sanctions on Russia for the invasion of Crimea.
However, distributors from Eastern European countries, particularly Belarus, have been trying to circumvent the ban, smuggling or re-packaging Belgian, French, and German food and shipping it to waiting buyers in Russia. The Russian government has not been pleased; thousands of tons of food have been confiscated and are being destroyed as part of the ban.
A petition with over 250,000 signatures has been circulating Moscow as people ask the food instead be donated to the poor, but the pleas have so far fallen on deaf ears.
Russian farmers have been generally happy with the ban; the vacuum left by foreign competition has been causing food prices to spike, and farmers are making much more for the same corps they produced before. The Russian Government has been focusing strongly on this “silver lining” that it may eventually push Russia along to self-sufficiency for food production.
The flip side, which the government has been largely ignoring, is that this spike in food prices is cripping the incomes of millions of people around the country. Over half the household budget of the average Russian family is spent on food, and this spike in prices is driving millions of people back under the poverty line.
This is one of the constantly trending topics in economics; should we raise the minimum wage?
This will be a brief look at some of the pros and cons- this will be updated with more cases for and against as time goes on and more recent, relevant research is added. If you know of a resource that we should include, but we haven’t, let us know on Facebook or Twitter and we will be sure to investigate!
Both sides of the debate have two prongs; the “alturistic” reasoning (i.e. the direct effect it will have on people earning the minimum wage), and the “Economic” reasoning (meaning the effect it will have on the economy as a whole). We will flesh out all points over the course of this week with more sources, articles, and papers based on our reader’s feedback!
Pro Arguments
Alturism
Paying the poorest people more will make them better off. Twenty-one states are raising their minimum wages in 2015 (the Federal minimum is $7.25/hour, which is observed in 29 states), and seem to agree.
Economics
By paying people more, they have more buying power, can spend more, and thus help support more local businesses through an increase in demand for consumer goods. As this increase in demand takes affect, the economy as a whole grows because of it.
Business Case
Paying people more for their work makes them more likely to stick around, reducing turnover costs. At first this might not seem like much, but at McDonalds they estimate that for every worker that quits, it costs over $4,500 to replace them, this amount is determined both by the costs of advertising the job and attracting new workers, staffing the HR department to process applications and do interviews, the time lost between when the last worker leaves and the new one starts, the loss of productivity for other staff while time is taken to train the new worker, and the equipment, uniforms, and tools that need to be provided to all new employees.
Franchises have a turnover rate of over 90%; more than 9 out of 10 employees who start in a year leave their job that same year, so that $4,500 is already considered part of the “cost” of hiring a new worker (since they assume they will leave earlier than later). Other studies have shown that every 10% increase in wages leads to a 2.2% lower turnover rate, since workers who earn more are more likely to keep their jobs.
Prices
Another study has shown that a jump to a $15 minimum wage would increase the cost of a Big Mac by about 17 cents. Most people argue that this is pretty small potatoes, since most change less than a quarter is dropped in a couch and forgotten about, so proponents of a higher minimum wage argue the price increase would be negligable to the average consumer, and not be a huge dent to overall demand.
Con Arguments
Alturism
By raising the minimum wage, especially by large amounts, businesses who rely on minimum-wage workers will simply only be able to hire fewer workers, which will make low-skill jobs even harder to come by. Raising the minimum wage may help the people who can keep their jobs, but it hurts the people who can no longer find work much more.
Opponents of a high minimum wage also point to the high turnover rate at minimum-wage positions as not necessarily a negative; they argue that if the minimum wage is too high, it works as a disincentive to people acquiring new skills or getting better jobs; if you can afford a small apartment and all your bills on the absolute minimum wage, they worry too many people would “take up the offer” and not continue to seek better positions, which are both better for the worker and more productive for society.
Economics
Think of it this way; how much a person is paid is usually determined by the labor market; it is a function of the value of their output and the quality of the work someone else would do if paid less. Raising the minimum wage does not change the value of a worker’s output, so since the actual cost of getting the same output increases for a company, they will produce less of it. This would lead to a decrease in total output, and shrinkage in the economy as a whole.
Business Case
From a business’s perspective, the worry that added costs in labor need to be taken from somewhere else; the same study that suggested that Big Macs could raise in price by 17 cents also suggested that the size of the sandwich could shrink somewhere between 12 and 70 percent.
While that might not sound like such a bad thing to health food enthusiasts, the ripple effect of that huge chunk of beef now not appearing in a burger, which is a huge blow to all the suppliers of the products being prepared and sold by minimum wage employees. From the ranchers that supply beef, to the shipping and distribution companies that deliver it to the stores, and the thousands of other suppliers involved in the production of the products in multi-billion dollar companies, this ripple can add up fast.
Prices
We have used McDonalds as the primary example so far, but they are really not a very good example in the grand scheme of things (in fact, McDonalds pays almost all employees well above the minimum wage, plus benefits, in all corporate-run stores, but they don’t make the wage rules at their franchises). Most minimum wage jobs are less “visible” than the uniformed ‘team members’ at a fast food chain, and range everywhere from stockers at retail stores, call center staffers (both customer service and sales), janitors and cleaners, window washers, and just about everything else you might not really think about day to day but still needs to get done.
This means that somewhere down the line, with every product or service you see, use, or consume, someone paid minimum wage was probably involved in getting it to you. Someone down the line from them probably was too. It might not be possible to calculate the full affect on prices that a raise of minimum wage will do, but you can be sure that it will be a lot wider spread than sandwiches.
Both of these arguments have stengths and weaknesses, we will examine both as this week continues. Stay tuned!
Open Interest is the total number of options or futures contracts that are “open”, meaning currently owned by an investor and not yet expired.
Details
Think first in terms of options contracts: by owning an option, it signifies that there is interest in actually trading that stock, although at a different price. Since this represents your “interest” in owning it, the “open interest” is how many shares people may be interested in trading, even if they do not actually trade.
Open interest is not to be confused with volume; it is just the total number of options or futures that are owned and not yet expired. A second definition of Open interest is the amount of open interest before the market opens, i.e. the number of open buy orders before the market officially opens, since it shares the same idea (how many shares people are thinking about trading, even though those trades have not yet happened).
Example:
Day
Trading
Open Interest
Summary
1
Trader A buys 1 option and Trader B sells 1 option (for options and futures if there is a buyer there must always be a seller)
1
There is one option bought currently. The seller does not count in this case.
2
C buys 3, and D sells 3
4
A and C now own 4 options between them.
3
A sells 2, C sells 3, and D buys 5
2
A still has 1 sold (written), B has 1 sold, C owns 0, D has 2, if we look at the bought the open interest is 2 despite the volume being 5
4
C buys 5 and D sells 5
2
Since the options have just changed hands the open interest remains the same. The volume is 5 once again.
5
A sells 3, B buys 3, C buys 2, D sells 2
9
A now has 4 sold, B has 2, C owns 7 and D has 5 sold
As you can see these transactions can get very complicated very quickly. The usefulness is undeniable, however, as it shows just how many people “interested” in the option.
Use
Since open interest indicates the number of “open” bought options this can give an indication of market sentiment and therefore the strength of the current trend. If there is very little open interest but a lot of volume it may be a good time to check why so many people are selling off their options.
On the other hand, a sudden jump in open interest can indicate that a rise in volatility is likely but gives little information on the direction of trend.
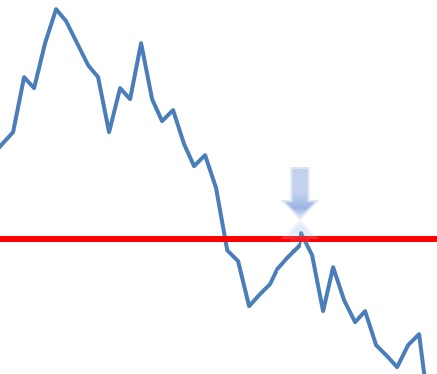
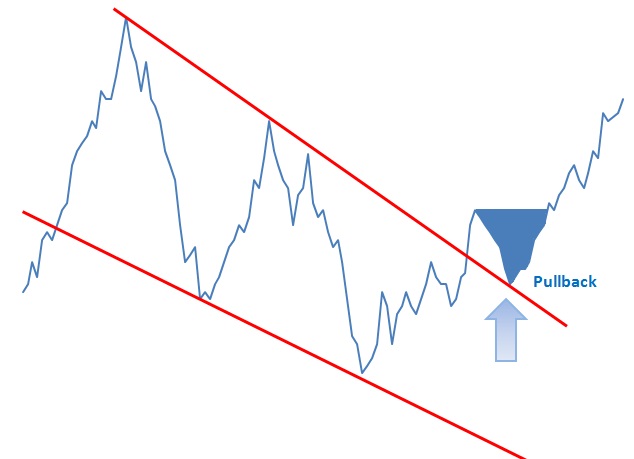
A pullback is a technical analysis term used frequently when a stock “pulls” back to a resistance and/or support line, usually after a breakout has occurred. Pullbacks can be in an uptrend or downtrend and can pull back upwards or downwards. In the example below we can see a pullback as it retraces back to the original trend. Pullbacks frequently become a new support or resistance line for the new trend as well. People have even created successful trading strategies centered around trading on pullbacks.
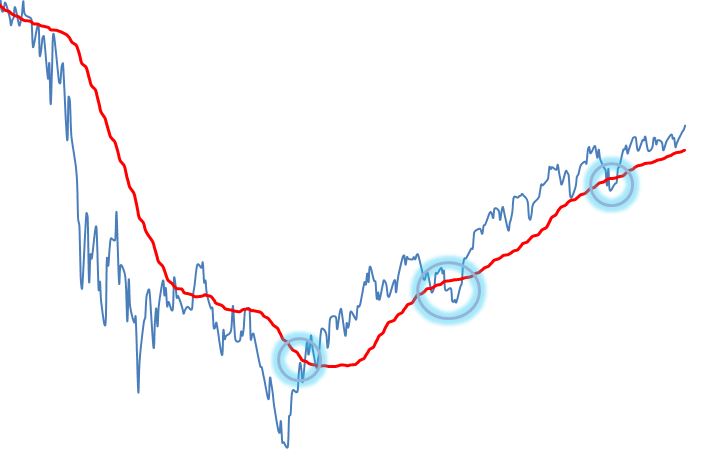
We can also see that depending on what you are using as a support or resistance line we can have a better look at pullbacks. In this case, we used a simple moving average.
From here we can see a very important aspect of pullbacks if we look at the first bubble. If we did not know any better it would simply look like it was pullback when in fact the price continued to climb and ended up breaking out. The other two bubbles are traditional downwards pullbacks.
Crude oil futures and Apple stock both took a big hit on Tuesday as weak demand for oil coupled with an unexpected drop in Apple stock.
The weakening of the price of Oil is somewhat expected; Summer is usually when global demand is at its highest, and with Fall approaching the markets expect demand, and therefore prices, to start to drop (even more than they already have). Analysts around the world are concerned that the oil prices will continue to drop, further hurting the already weak prices and causing a deeper drop in Energy stocks.
However, by Wednesday morning, both the Apple and Oil prices started a modest recovery, which investors jumped on with fervor. At this time, it is unknown if the recovery will continue, but analysts are searching out any sign of strength, or weakness, in the markets as a whole while the Federal Reserve Bank weighs increasing interest rates.
We picked blue chip stocks in the Dow Jones Industrial Average, and tried to balance analyst ratings, Price/Earnings (P/E) ratios, the latest news, and our own instincts.
Even though there were only 30 stocks to choose from, it took hours to go over all the research we wanted to do to put together a portfolio, and come up with a good strategy.
Most of our losses came very early on from Disney ([hq]DIS[/hq]) that took a huge hit. For a short time, we were even in last place! However, we had a back-up plan, and if this contest kept going for a few more months, we are confident our strategy would have proven profitable.
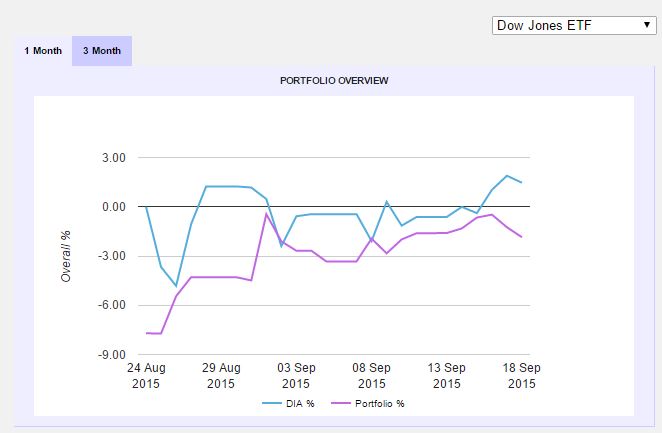
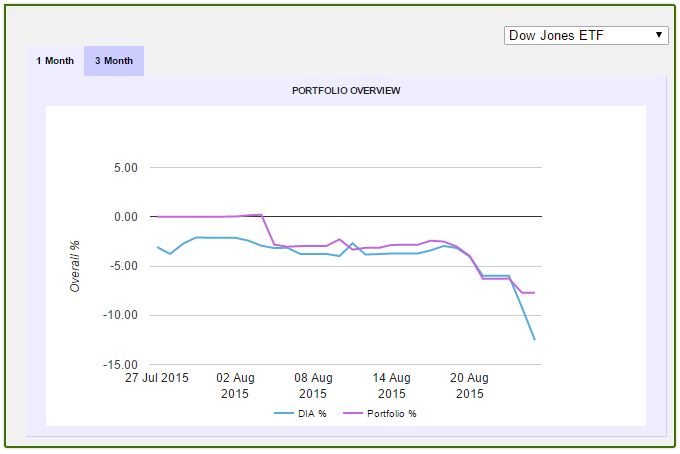
You can actually see in our performance graph that we out-performed the Dow during the whole trading period, so we actually beat our benchmark market!
In future challenges, we will probably keep using a Dow ETF as part of our holdings.
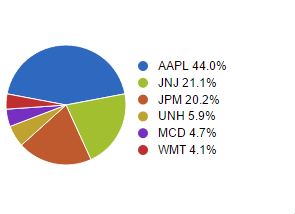
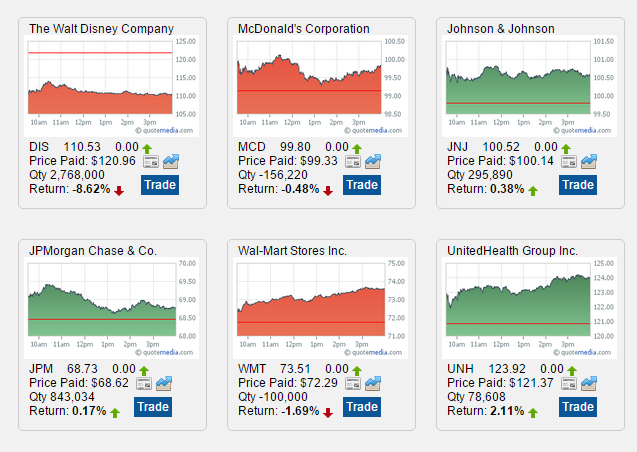
Final Open Positions and Portfolio Allocation
Performance Over The Total Contest
See More Trading Strategies From This Contest
Phil Simard’s Blue Chip Investment Strategy-Final Rank: 318 / 518 Final Portfolio Value: $992,114,784.48 (-0.79%) Investment Strategy For The Blue Chip Investment Contest Since time was very limited for me in the Blue Chip Investment Challenge. I just tried to get as much profit as possible by trading SPXU and other triple leveraged ETF’s and trying to time the market. Read More...
Ross LoGiudice’s Blue Chip Challenge: Lessons from Diversifying-Final Rank: 338 / 518 Final Portfolio Value: $979,922,717.88 (-2.01%) Investment Strategy For This Contest I don’t know if what I did even qualifies as strategy. I purchased about 20 or stocks that were familiar and then I closed my eyes and crossed my fingers. The end result was losses across the board that ranged Read More...
Kevin Smith’s Blue Chip Challenge Investment Strategy-Final Rank: 331 / 518 Final Portfolio Value: $985,785,982.85 (-1.42%) Investment Strategy For This Contest This was a contest where I wanted to go big or crash hard. The news leading up to the contest was dominated by the crash in oil prices, so I figured that there would probably be a rebound coming soon. Read More...
Team HTMW Blue Chip Challenge Investment Strategy-Final Rank: 336 / 518 Final Portfolio Value: $981,381,149.90 (-1.86%) Investment Strategy For This Contest We picked blue chip stocks in the Dow Jones Industrial Average, and tried to balance analyst ratings, Price/Earnings (P/E) ratios, the latest news, and our own instincts. Even though there were only 30 stocks to choose from, it took hours to Read More...
Details about our trades during the contest
This is where we will keep track of the holdings for the Official Team HowTheMarketWorks Portfolio, with how much of each company we are holding, and why we picked those stocks. Remember, everything in the TeamHTMW portfolio is a Blue-Chip stock included in the Dow-Jones Industrial Average, some of the biggest companies in the world. For the full contest rules, how to participate, and what you can get if you beat our portfolio (or finish in the top 5 overall), Click Here!
If you think we picked poorly, or want to brag on how badly you’re beating us, post a message to our Facebook or tag us on Twitter. We will be picking cool posts and tweets to feature on our feeds, so lets see what you’ve got!
Day 32
Only a couple weeks left in the competition, we are increasing our stakes in almost all of our current holdings! The only one we did not increase is McDonalds (MCD), because we read they are going to start selling breakfast 24 hours a day, which has the potential to really boost revenue. We are currently shorting them, and still think they will be down in the next two weeks.
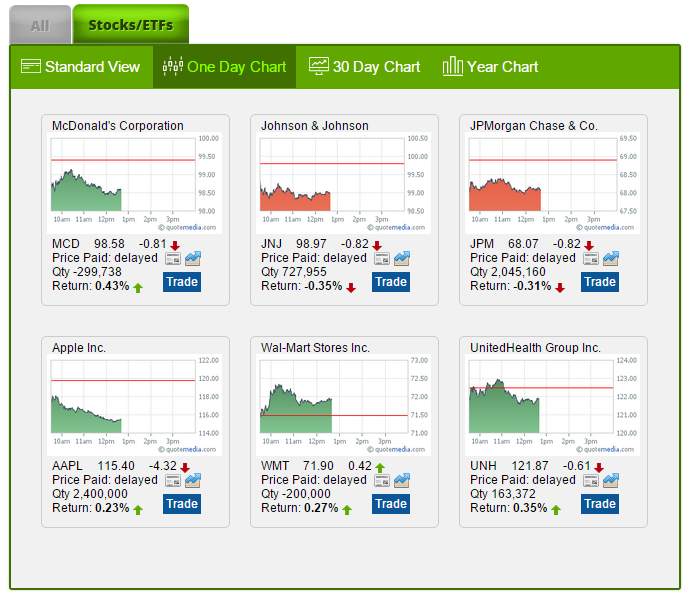
Day 26
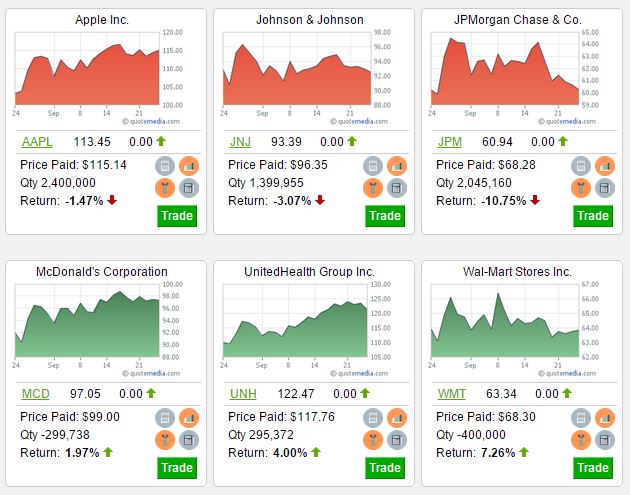
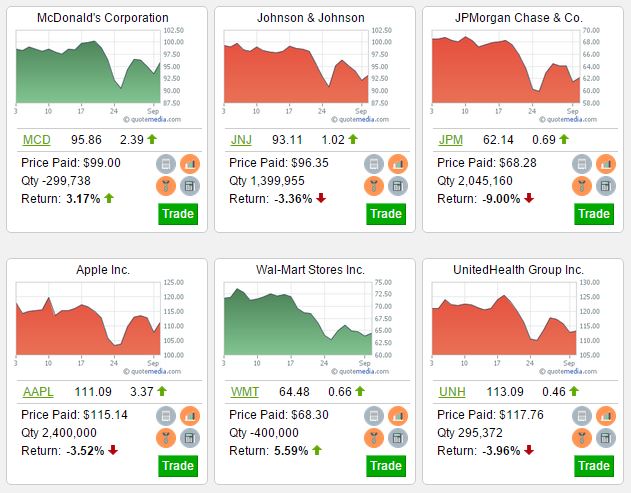
We are keeping our holdings strong, even though we have seen some losses. Our portfolio is still a bit of a mixed bag:
We’ve made the most so far on our Shorts, which were well placed for the global sell-off that hurt stock values all over the world. We have faith that our other picks are going to turn around in the mid-to-long term, but we are no longer fighting to stay out of last place!
However, when we’re looking at the market as a whole compared to our portfolio performance, the HTMW team picks are actually out-performing the Dow Jones as a whole:
2 weeks of competition left! Lets see what you’ve got!
Day 8
Not much to brag about, we’re still recovering from our big Disney loss. We’ve recovered some ground since then, now we are seeing a bit more green in our Open Positions:
This is despite the DOW as a whole losing over 200 points today, so I’d say not too shabby!
Day 3
We were going strong, but we took a huge hit with our Disney pick!
Today we will be cashing out as much Disney stock as we can, given market volume, and switching over to Apple (AAPL), which has been seeing a lot of good analyst ratings, and a P/E ratio of 13.3.
Day 1
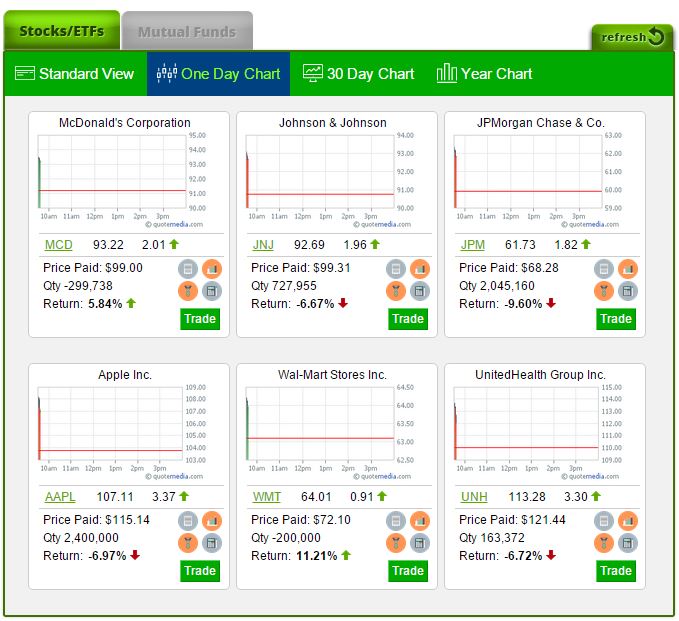
These are the stocks we picked to kick off the competition, but our holdings will probably change a lot as the competition goes on!
JP Morgan is a finance juggernaut, it has been growing rapidly ever since the end of the financial crash, with no signs of slowing down soon. Their P/E ratio wasn’t that impressive (12.4 when we bought it), but their 3-month chart is pushing upwards, and both the Chaikin Power Tool on the Trade page and the Analyst Ratings in Quotes agree that it is a good stock to buy. Their news was not impressive though, so we will keep a close eye on this one.
In terms of news, Walmart can’t really catch a break. They have constant bad will from consumers because of low wages for employees (although as we have covered before, that may be changing), and in popular culture they are usually regarded as nothing short of classless. However, we see a less-than-stellar P/E ratio (14.5), their 3-month chart is trending downwards, and no analysts we are seeing (both Chaikin and our Quotes analysts) seem to think it would be a great stock to buy (although they currently don’t recommend selling it if you already own it). We went short for now, and will keep an eye on it over the next week or two.
Disney has been on a streak over the last year or two, with hit movies like Frozen tearing up the box office and merchandizing opportunities (we recently saw a Frozen Breakfast Cereal on the shelves, you know they’re making money on that!), but their gaming branch has also been making waves around the world. The Star-Wars franchise is coming out with the first movies in the new series soon, and the Avengers appear unstoppable. To cap it off, their P/E ratio is good (25.8), and all analysts we looked at agree they were a good buy.
Not too much to say about Johnson and Johnson, they have a pretty good PE ratio (17.6), and their 3 month chart is fairly stable. Most analysts agree they are a good buy, and we expect this to be our “least exciting” pick in this round. However, J&J have historically been a very solid stock to own, with very little drama and good performance even in shaky markets. At the end of the day, it is stocks like Johnson and Johnson that will anchor a retirement portfolio, so we are happy to have it on the team!
McDonalds is another long-standing chain that is having trouble in recent years. Added competition from “Fast-Casual” restaurants like Chipotle (CMG) have been eating its market share, and it is so massive that even its constant efforts to refresh and improve its menu lineup are expensive, and never really received with much enthusiasm. It is just hard to think of eating healthy at McDonalds, although they are spending a lot of time, effort, and money to change that perception. We will see how that goes, but for now even their good P/E ratio (23.2) and decent 3-month charts are not making up for the bad press.
Insurance stocks are a lot like Johnson and Johnson; they usually will not attract too much attention, but they can be good anchors to a balanced portolio. However, not all insurance stocks are created equal, in the DOW alone we could have easily gone with Travelers TRV. However, we stuck with United because we think their better P/E ratio (19.3 versus 9.8), stronger 3-month chart, and positive news made it a better bet in the middle-term. However, we will be keeping an eye on both, so don’t be surprised if you see less UNH and more TRV in our portfolio as the competition moves forward!
Notice: This is not to serve as investment advice, only our picks for the Blue Chip Challenge competition, and why we picked them. No person who chose a stock here owns that stock as part of their own personal portfolio.
Click Here To Join The Next Contest!
See More Trading Strategies From This Contest
Phil Simard’s Blue Chip Investment Strategy-Final Rank: 318 / 518 Final Portfolio Value: $992,114,784.48 (-0.79%) Investment Strategy For The Blue Chip Investment Contest Since time was very limited for me in the Blue Chip Investment Challenge. I just tried to get as much profit as possible by trading SPXU and other triple leveraged ETF’s and trying to time the market. Read More...
Ross LoGiudice’s Blue Chip Challenge: Lessons from Diversifying-Final Rank: 338 / 518 Final Portfolio Value: $979,922,717.88 (-2.01%) Investment Strategy For This Contest I don’t know if what I did even qualifies as strategy. I purchased about 20 or stocks that were familiar and then I closed my eyes and crossed my fingers. The end result was losses across the board that ranged Read More...
Kevin Smith’s Blue Chip Challenge Investment Strategy-Final Rank: 331 / 518 Final Portfolio Value: $985,785,982.85 (-1.42%) Investment Strategy For This Contest This was a contest where I wanted to go big or crash hard. The news leading up to the contest was dominated by the crash in oil prices, so I figured that there would probably be a rebound coming soon. Read More...
Team HTMW Blue Chip Challenge Investment Strategy-Final Rank: 336 / 518 Final Portfolio Value: $981,381,149.90 (-1.86%) Investment Strategy For This Contest We picked blue chip stocks in the Dow Jones Industrial Average, and tried to balance analyst ratings, Price/Earnings (P/E) ratios, the latest news, and our own instincts. Even though there were only 30 stocks to choose from, it took hours to Read More...
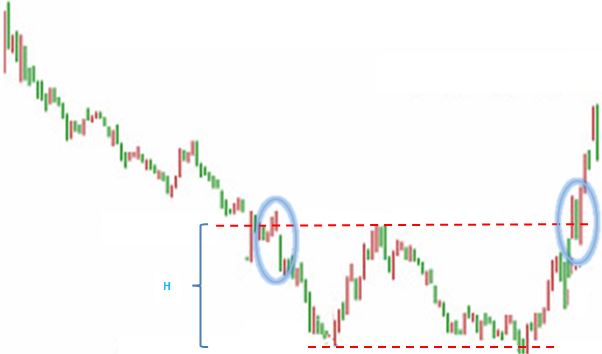
Double Bottoms are reversal patterns very similar to the bottom head and shoulders pattern, and are often seen when trading currencies. Double Bottom patterns are identified by two low prices of the same depth with a medium pullback in between.
Double bottoms can be a major reversal pattern that often follow an extended downtrend. When you confirm this pattern is occurring, and there is a significant amount of volume during the uptrend, it is time to “go long”.
Here is the general form of a double bottom pattern. As with most technical analysis patterns, they are a guideline but can differ from this graph to an extent. What is important to note is:
The pattern begins with a strong down trend (the stronger the trend, the better the reversal)
The bottom points should be roughly at the same height (most consider roughly 10 – 20% to be acceptable)
At the second circle on the picture above, the line should be traced at the top of the pullback.
Many consider the height (h in the digram) to be the height that the trend will go above the top line and will place their limit or stop orders accordingly.
There should also be significant volume when the stock breaks upward; you can get a “False Flag” if you see something resembling this pattern, but no increase in volume near the end to signal the reversal is real.