Stop Wasting Money on High Interest Rate Credit Cards
All credit cards are NOT the same–find the credit card that is right for you!
If you get good grades, then choose a credit card that gives you a reward bonus for good grades. If you can’t pay off your credit card bill each month, then make sure you have the lowest interest rate available. If you travel a lot, then make sure you are earning frequent flyer rewards. If you have a credit card and use it, then make sure you are getting something back and have the right card for you.
If you are a college or high school student, you might want to be taking advantage of the credit cards that are designed just for students.
If you are paying a high rate of interest on your credit card, then look at the “Low Interest” and “Balance Transfer” options. Paying high interest rates on your credit cards when you don’t have to is a waste of money. If you have $10,000 of credit card debt and you can drop your rate by 5% then you can save $41.66 a month! Stop wasting money–take 10 minutes and save!
Take a look at this chart and click on the card type that interest you:
Credit Card Payoff Calculator
If you already have a credit card and are not paying if off each month, then use this credit card payoff calculator to see how long it will take you to payoff the card.
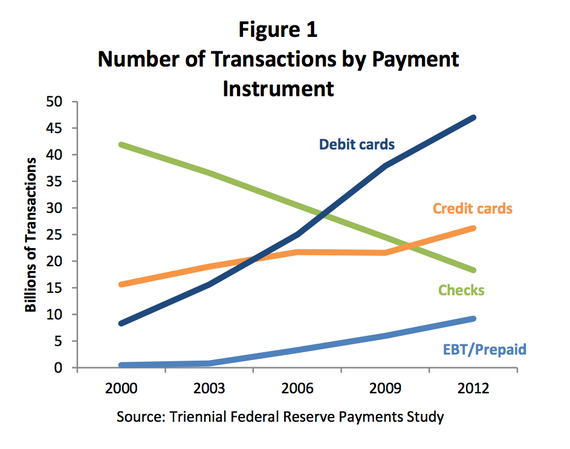
Since 2010 the use of credit cards has become more popular than writing checks when paying for everyday purchases. The banks have made it easy for most people to get a credit card, and most retailers have made it very easy to use them.
What is a Credit Card?
A credit card is a payment system that works like this:
A persons signs a bank application for a credit card and agrees to pay the credit card bill on a monthly basis.
The bank gives the person a credit card with a unique 16 digit number on it.
The person presents the credit card for payment at a store and signs a credit card slip indicating they have received the goods.
Every month the bank then sends the person a credit card statement showing all the charges and usually gives the person about 20 days to pay the statement in full.
If the person doesn’t pay the bill in full by the due date, the credit card copy then charges the person interest.
It sounds like a great system, as long as you can pay your credit card statement in full and on time. If you don’t the interest rates charged by the bank can be anywhere from 10 to 30%. That’s why it is very important to choose your credit card wisely!
Check out the latest credit card interest rates below. Click on the card type that most interests you.
Credit Card Payoff Calculator
If you don’t pay off your credit card statement in full by the due date, you can quickly dig yourself into a bad cycle of falling more and more in debt because of the interest rate and fees your may be charged. Use this Credit Card Payoff Calculator to what happens if you don’t pay the full amount due each month.
Here are some popular stories and advice for credit card users:
I usually found stocks that had high volume and good community sentiment. As well as good stock short term news. I then bought into those stocks, and when they went up. I shorted them. MACD and Bolinger bands were also used in my trading strategies.
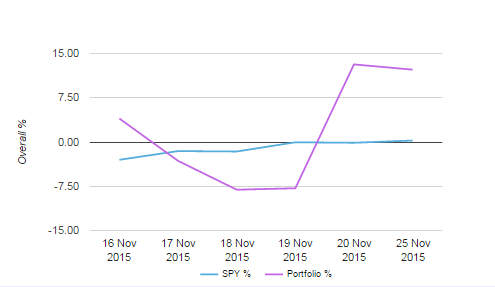
Final Open Positions and Portfolio Allocation
Performance Over The Total Contest
Click Here To Join The Next Contest!
See More Trading Strategies From This Contest
sgsadamc’s November Investing Strategy-Contest: Second November Investing Contest Final Rank: 2 Final Portfolio Value: $113,134.06 (+13.13%) Trading Strategy For This Contest I usually found stocks that had high volume and good community sentiment. As well as good stock short term news. I then bought into those stocks, and when they went up. I shorted them. MACD and Bolinger Read More...
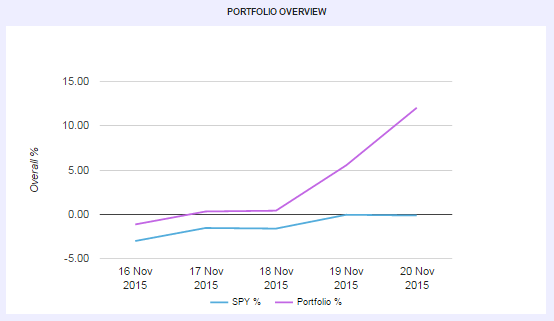
Branflakes’s November Investing Contest Strategy-Contest: Second November Investing Contest Final Rank: 5 Final Portfolio Value: $112,017.03 (+12.01%) Trading Strategy For This Contest I looked for low prices stocks breaking new highs and held on for a couple minutes or over night, then I sold them, sometimes shorting stocks that are too hyped up Performance Over The Total Contest Click Read More...
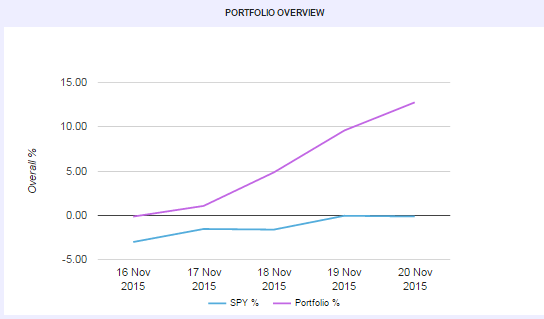
NickStalksStocks’s Investing Contest Strategy-Contest: Second November Investing Contest Final Rank: 3 Final Portfolio Value: $112,739.67 (+12.73%) Trading Strategy For This Contest First off, thanks for the great game everyone! Well played. This being my first HTMW monetized contest, I feel very humbled and excited to win. During last week, I played the VIX and biotech stocks. TVIX and Read More...
I looked for low prices stocks breaking new highs and held on for a couple minutes or over night, then I sold them, sometimes shorting stocks that are too hyped up
Performance Over The Total Contest
Click Here To Join The Next Contest!
See More Trading Strategies From This Contest
sgsadamc’s November Investing Strategy-Contest: Second November Investing Contest Final Rank: 2 Final Portfolio Value: $113,134.06 (+13.13%) Trading Strategy For This Contest I usually found stocks that had high volume and good community sentiment. As well as good stock short term news. I then bought into those stocks, and when they went up. I shorted them. MACD and Bolinger Read More...
Branflakes’s November Investing Contest Strategy-Contest: Second November Investing Contest Final Rank: 5 Final Portfolio Value: $112,017.03 (+12.01%) Trading Strategy For This Contest I looked for low prices stocks breaking new highs and held on for a couple minutes or over night, then I sold them, sometimes shorting stocks that are too hyped up Performance Over The Total Contest Click Read More...
NickStalksStocks’s Investing Contest Strategy-Contest: Second November Investing Contest Final Rank: 3 Final Portfolio Value: $112,739.67 (+12.73%) Trading Strategy For This Contest First off, thanks for the great game everyone! Well played. This being my first HTMW monetized contest, I feel very humbled and excited to win. During last week, I played the VIX and biotech stocks. TVIX and Read More...
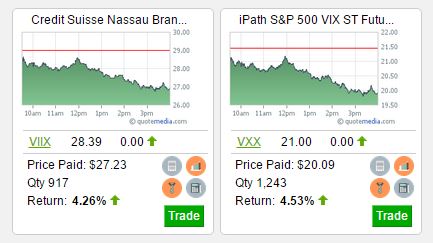
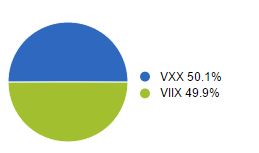
First off, thanks for the great game everyone! Well played. This being my first HTMW monetized contest, I feel very humbled and excited to win.
During last week, I played the VIX and biotech stocks. TVIX and UVXY are 2x leveraged etfs for the VIX (CBOE Volatility Index). After the terrorists attacks, I knew the market would be in a state of chaos so I used that to my advantage while day trading the VIX
As well I bought and sold stocks such as AVXL and KBIO. These were over bought/sold stocks along with news being released about the stocks. Honestly, most of the time with these small cap biotechs you have to go with community sentiment to win.
Thanks
Nick
Performance Over The Total Contest
Click Here To Join The Next Contest!
See More Trading Strategies From This Contest
sgsadamc’s November Investing Strategy-Contest: Second November Investing Contest Final Rank: 2 Final Portfolio Value: $113,134.06 (+13.13%) Trading Strategy For This Contest I usually found stocks that had high volume and good community sentiment. As well as good stock short term news. I then bought into those stocks, and when they went up. I shorted them. MACD and Bolinger Read More...
Branflakes’s November Investing Contest Strategy-Contest: Second November Investing Contest Final Rank: 5 Final Portfolio Value: $112,017.03 (+12.01%) Trading Strategy For This Contest I looked for low prices stocks breaking new highs and held on for a couple minutes or over night, then I sold them, sometimes shorting stocks that are too hyped up Performance Over The Total Contest Click Read More...
NickStalksStocks’s Investing Contest Strategy-Contest: Second November Investing Contest Final Rank: 3 Final Portfolio Value: $112,739.67 (+12.73%) Trading Strategy For This Contest First off, thanks for the great game everyone! Well played. This being my first HTMW monetized contest, I feel very humbled and excited to win. During last week, I played the VIX and biotech stocks. TVIX and Read More...
Students can never have too much math! These lesson plans are applied lessons in math, from showing how to calculate simple interest to determining “Price Per Unit” when shopping.
Description: This is a basic introduction to interest and its calculation for students. It covers a few different interest rate levels and time periods.
Using HowTheMarketWorks: We make it interactive! Have your students use our Investment Return Calculator to calculate the growth of savings over time, showing the difference between simple interest and compound interest, and even adjust according to inflation! This is also integrated into our Assignments feature, so your students can answer the quiz at the end and get credit using your Report Card.
Source: EconEdLink, by Connections Cross-Curricular
Description: This lesson is a basic approach to calculating interest using a jellybean exercise (with an interest-bearing jellybean account), building into real-world exercises with bank rates.
Description: These lesson plans walk students through the basics of interest growth and compounding. The second half goes through more complex topics like Real interest rate, returns on investment, and nominal interest rate, but the first half of the lesson is appropriate for younger students.
Using HowTheMarketWorks: Our Compound Interest Calculator is great for the first half of the lesson, where students can see how their savings grows over time, while our Investment Return Calculator is great for the second half, since it can be used to control for inflation to find Real and Nominal interest rates. Since these are both integrated into our Assignments feature, it makes it easy to assign as homework, and follow all your students’ progress in their Report Card!
Description: Students will work through a list of groceries and attempt to see which is offering the best “Deal” by calculating and comparing the price per unit.
Using HowTheMarketWorks: When students are buying Exchange Traded Funds on HowTheMarketWorks, it is possible that the underlying assets of the fund are worth more or less than what the ETF is actually trading at in the markets. Have your students calculate the value of [hq]DIA[/hq], an ETF that tracks the Dow-Jones Industrial Average, using the value of the underlying stocks (they can find this information under “Filings” when looking up DIA in the Quotes tool). Is the ETF trading at a higher or lower value than its underlying assets?
Our November investing contests are now finished, we had tens of thousands of trades placed to fight for the top spots! See the winners below! If you want a shot at a cash prize yourself, join our next contest!
Click Here To Join The Next Contest!
First Weekly Contest
blowke+15.56%
Second Weekly Contest
brendanriley+15.41%
sgsadamc+13.13%
NickStalksStocks+12.74%
bobbyv+12.27%
Branflakes1212+12.02%
The HTMW Team Finishers were:
gbrown+2.48%
TeamHTMW+1.79%
ksmith-1.27%
See The Trading Strategies From This Contest!
sgsadamc’s November Investing Strategy-Contest: Second November Investing Contest Final Rank: 2 Final Portfolio Value: $113,134.06 (+13.13%) Trading Strategy For This Contest I usually found stocks that had high volume and good community sentiment. As well as good stock short term news. I then bought into those stocks, and when they went up. I shorted them. MACD and Bolinger Read More...
Branflakes’s November Investing Contest Strategy-Contest: Second November Investing Contest Final Rank: 5 Final Portfolio Value: $112,017.03 (+12.01%) Trading Strategy For This Contest I looked for low prices stocks breaking new highs and held on for a couple minutes or over night, then I sold them, sometimes shorting stocks that are too hyped up Performance Over The Total Contest Click Read More...
NickStalksStocks’s Investing Contest Strategy-Contest: Second November Investing Contest Final Rank: 3 Final Portfolio Value: $112,739.67 (+12.73%) Trading Strategy For This Contest First off, thanks for the great game everyone! Well played. This being my first HTMW monetized contest, I feel very humbled and excited to win. During last week, I played the VIX and biotech stocks. TVIX and Read More...
About The Challenge
We held 2 week-long contests in November: one a winner-takes-all, and the other giving prizes to the top 10 portfolios. As with all of our contests, everyone starts with $100,000, and can invest in any collection of US stocks or ETFs. There is a 25% position limit, so you can’t put more than a quarter of your portfolio in any one symbol.
Rules
There will be a full audit at the end of the investing contest on all winners to verify any corrections due to stock splits, dividends, or any other corporate action our team may have missed. Only legitimate portfolio returns will be counted in the ranking.
Each person is allowed only 1 entry. Users with multiple portfolios in the contest will be disqualified.
The usernames of the winners will be made public, but not their actual first name, last name, nor email address.
No member of the HowTheMarketWorks Team is eligable for any prizes
Other Prized Contest Results
Fall 2017 Challenge-Win prizes in our stock market contests! Find all of the information for any stock contests with prizes we are currently running here! You can also find information on past contests and their winners. Register Here To HTMW Fall Challenge Who can join? Anyone can join! Joining our stock market contests is completely free, so Sign Up Read More...
Back To School Challenge-Our Back To School Challenge is now finished, we had tens of thousands of trades placed to fight for the top spots! See the winners below! If you want a shot at a cash prize yourself, join our next contest! Click Here To Join The Next Contest! Stock Trading Contest Result Fractals7 Namburiv Catspaws Igorski123 Read More...
April Trading Contest-Our April Trading Contest is now finished, we had tens of thousands of trades placed to fight for the top spots! See the winners below! If you want a shot at a cash prize yourself, join our next contest! Click Here To Join The Next Contest! Stock Trading Contest Result TJack43 EddieB18 Housemanager brucehaan wolforda17 About Read More...
March Trading Contest-Our March Trading Contest is now finished, we had tens of thousands of trades placed to fight for the top spots! See the winners below! If you want a shot at a cash prize yourself, join our next contest! Click Here To Join The Next Contest! Stock Trading Contest Results MichaelGebhart +53.77% wpeldiak +50.55% Janene +31.00% Read More...
February Trading Contest-Our February Trading Contest is now finished, we had tens of thousands of trades placed to fight for the top spots! See the winners below! If you want a shot at a cash prize yourself, join our next contest! Click Here To Join The Next Contest! Stock Trading Contest Results almater1 +44.59% Housemanager +43.9% Michael +35.1%% Read More...
January Stock Trading Contest-Our January stock trading contest is now finished, we had tens of thousands of trades placed to fight for the top spots! See the winners below! If you want a shot at a cash prize yourself, join our next contest! Click Here To Join The Next Contest! Stock Trading Contest Results smithjj5 +30.19% blowke +28.64% qtran12203 Read More...
December Stock Trading Contest-Our December stock trading contest is now finished, we had tens of thousands of trades placed to fight for the top spots! See the winners below! If you want a shot at a cash prize yourself, join our next contest! Click Here To Join The Next Contest! Stock Trading Contest Results smithjjj5 – +36.28% Return mchung37 Read More...
November Investing Contest Results-Our November investing contests are now finished, we had tens of thousands of trades placed to fight for the top spots! See the winners below! If you want a shot at a cash prize yourself, join our next contest! Click Here To Join The Next Contest! First Weekly Contest blowke +15.56% Second Weekly Contest brendanriley +15.41% Read More...
October Stock Contest Results!-The October stock contests are finished, with over a thousand participants from all over the world! We had hundreds of thousands of trades placed, and already gave away almost $1000! See who won below! First Weekly Contest The Top 5 performers by portfolio value were: hoabidebay +16.94% kingsalman+14.36% brucehaan +14.08% daniellopez +10.16% Housemanager +9.83% The Read More...
September Monthly Million Challenge!-The September Monthly Million Challenge is the first in our Monthly Million series, with over a thousand participants from all over the world! The rankings were fierce, with the HowTheMarketWorks team scattered throughout, but you’ll be surprised who won! The Top 5 performers by portfolio value were: AngelRivera +30.81% Janene+23.14% wkaraman14 +18.15% puttno2 +12.63% smithjjj5 Read More...
Simply put, when you have money to invest for an extended period of time (like 20 years or more), the stock market historically has provided the greatest return.
When most people are able to save money, they usually put it in the bank. Banks usually pay interest on the cash in your account, so if you have 1,000 in your savings account, and the bank pays you 3% interest then at the end of a year you will have about 1,030. Once the savings balance gets bigger, a lot of people hope to earn more than what the bank is paying in interest, so they invest in real estate, stocks, bonds, and/or gold.
Historical Returns of Investments
While no one knows for sure what will happen in the future, a look at historical returns shows how these different investments have performed over time.
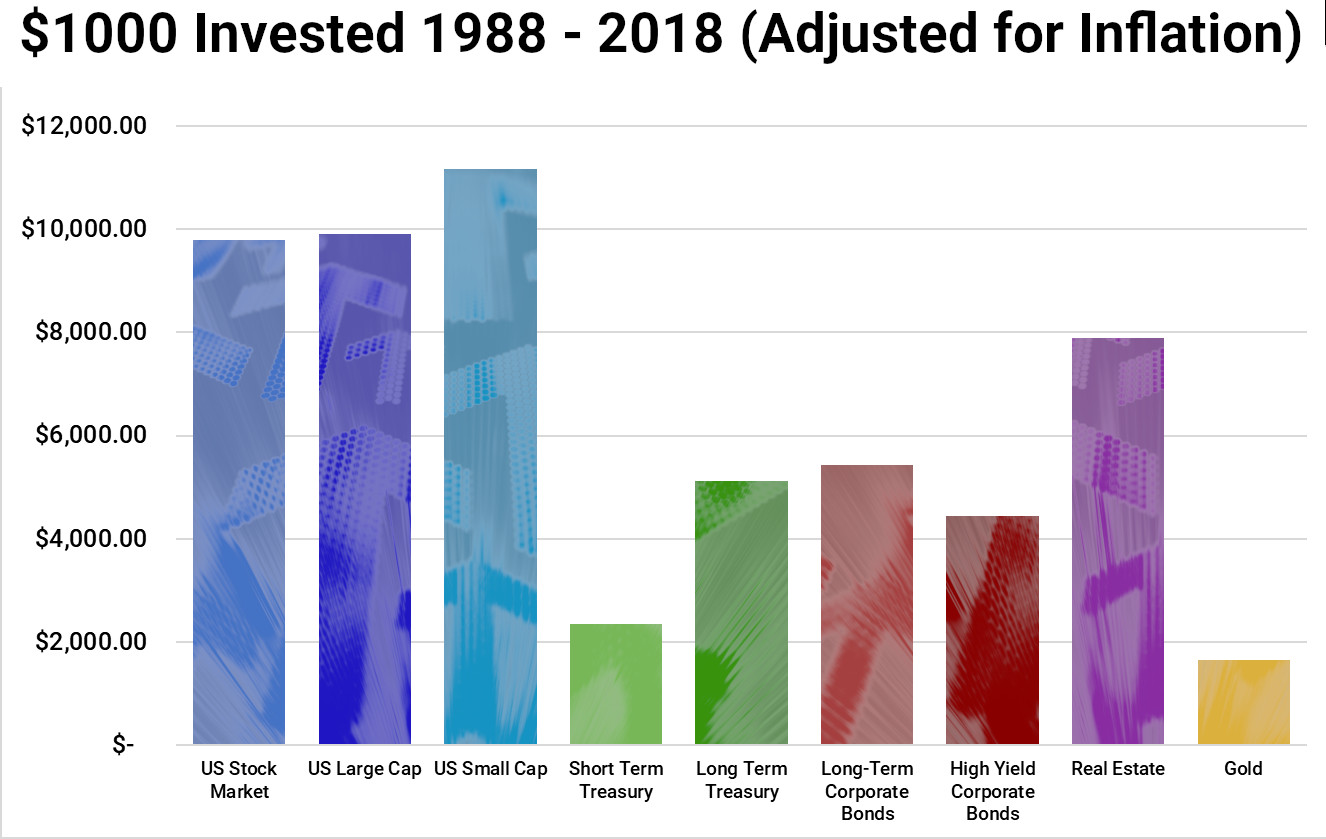
Here’s a chart of average percentage returns for the 30 year period from 1988 to 2018:
Data Source: Portfolio Visualizer.com
From this chart we see that the stock market has performed the best – between a 9-fold and 11-fold increase, depending on the security types. Gold performed the worst – one major reason being that gold tends to go up in price during years where there is low inflation, and down in years with high inflation.
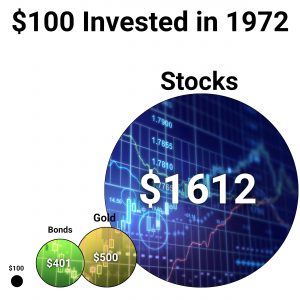
So what does that mean? Over time there is a HUGE difference between 10% and 2%. Here is another way to look at it–this chart shows the growth of $100 for the 46 years from 1972 to 2018.
So, would you rather have 401 or 1,612! That’s a big difference for just 100. For 10,000 the results would be exactly 100x or 40,100 versus 161,200.
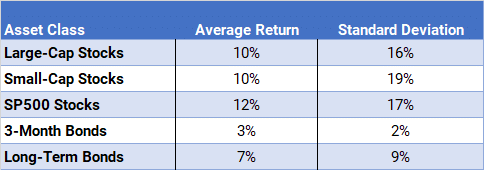
Finally, this chart looks at average returns from 198 through 2018 and shows that the S&P 500 stocks were the best return, with a 12% average annual return – beating out both the large-cap stocks in the Dow Jones Industrial Average and the Small-Cap stocks in the Russell 2000 index.
In this table you also need to note the Standard Deviation column which measures the variance or volatility of the returns. It shows that Small Stocks also have the highest variance. This is why we say “over time” that stocks have the highest returns. If you looked at just one year or even five years, you might not see the same results because stocks are so volatile, but the longer the time period you have to keep the money invested the better it is to invest in stocks.
Summary
Simply put, if you want to maximize your personal net worth, if you want to be rich, if you want to be a millionaire, if you want to retire early–you must start saving and investing TODAY.
The earlier you get started, the more time your money has to grow. And the more time it has to grow, the bigger it will become.
Understanding how the stock market works and how to invest is so important because it determines how much your net worth will be when you retire. Are you going to leave your cash in your savings account at the bank all your life and earn an average of 3%? Or are you going to invest it in the stock market and try to earn 11%?
How To Invest in the Stock Market
The best way to learn anything is to practice. Use this virtual trading site to learn to invest and experiment with trading strategies. Don’t worry if you make mistakes–better to lose our fake money then your real money later.
You can use www.StockBrokers.com to compare special offers, commission rates, and other services of more online brokerages to find the perfect one for you. (Don’t worry, you can click www.StockBrokers.com and it will open a new tab so you won’t lose your place in this course.)
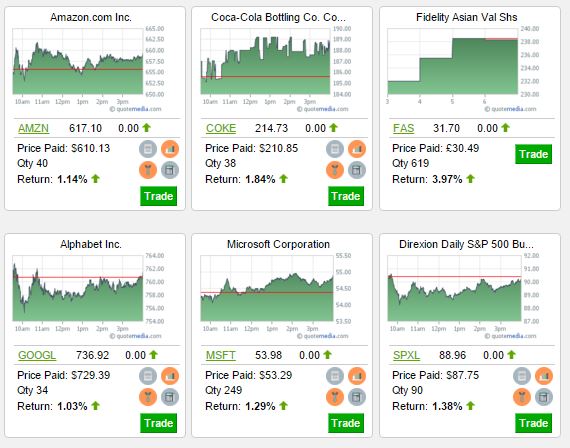
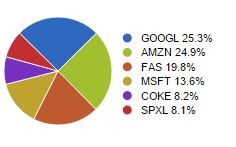
For the October 3rd Daily Contest I picked a mix between triple-leveraged ETFs and a few companies that I felt were undervalued. The triple-leveraged ETFs are great for a daily competition because the profits are huge if you are on the right side of the market. My big winner ended up being FAS, a triple-leverage financial bull. I also made a good profit on AMZN and GOOGL because I felt they were undervalued and I got lucky because they had a lot of positive movement that day.
Click Here To Join The Next Contest!
AWESOM-0’s Third October Daily Contest Trading Strategy-Contest: October Third Daily Challenge Final Rank: 7 Final Portfolio Value: $101,621.37 (+1.62%) Trading Strategy For This Contest For the October 3rd Daily Contest I picked a mix between triple-leveraged ETFs and a few companies that I felt were undervalued. The triple-leveraged ETFs are great for a daily competition because the profits are huge if Read More...
RUINTHERE’s Third October Daily Contest Trading Strategy-Contest: October Third Daily Challenge Final Rank: 1 Final Portfolio Value: $108,724.97 (+8.72%) Trading Strategy For This Contest The strategy I prefer to use is to look for stocks that have been unfairly beaten down. Many stocks are down at any given time and most justifiably so. However, there are those that have become oversold. Read More...
RiskOn’s October Day Trading Strategy-Contest: October First Daily Challenge Final Rank: 1 Final Portfolio Value: $104,671.33 (+4.67%) Day Trading Strategy For This Contest For this daily contest, I purchased 4 ETF stocks, then sold 2 of them once I had a good lead, not wanting to give up all of my gains. My strategy is to purchase the riskiest Read More...
ksmith’s October Day Trading Strategy-Contest: October First Daily Challenge Final Rank: 3 Final Portfolio Value: $102,112.25 (+2.11%) Day Trading Strategy For This Contest For this day-trading contest, my big winners were the triple-leveraged ETFs (Click Here for a list of leveraged ETFs!) [hq]DWTI[/hq] and [hq]JDST[/hq]. [hq]DWTI[/hq] is a triple-leveraged Bear Oil ETF, so when oil goes down by 1%, Read More...
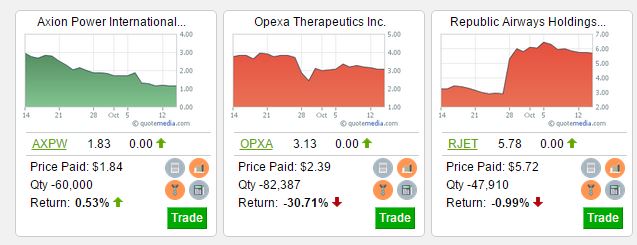
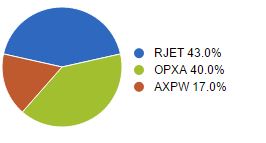
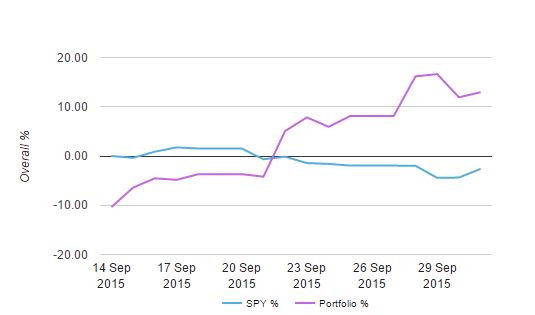
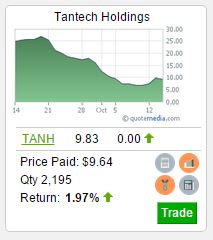
hoabidebay’s First October Week Contest Trading Strategy-Contest: October First Weekly Challenge Final Rank: 1 Final Portfolio Value: $116,943.82 (+16.94%) Trading Strategy For This Contest I select highly volatile and liquid stocks / ETFs to trade, paying attention to how they behave (gap up/down) the 1st 15 min of the opening session. Final Open Positions and Portfolio Allocation Performance Over The Total Read More...
BranFlakes1212’s October Day Trading Strategy-Contest: October First Daily Contest Final Rank: 6 Final Portfolio Value: $101,341.05 (+1.34%) Day Trading Strategy For This Contest I usually focus on Lower priced stocks because they tend to be more volatile. Tuesday however didn’t have very many stocks doing what I prefer to trade, so I pretty much picked one of the top Read More...
The strategy I prefer to use is to look for stocks that have been unfairly beaten down. Many stocks are down at any given time and most justifiably so. However, there are those that have become oversold. When the weak hands have already sold the bargain hunters move in. These points can be identified through technical analysis tools such as MACD, TRIX, and others. But technical analysis on its own isn’t enough. It is necessary to follow company specific, industry, and general news to understand the context of what the charts are saying. If you not careful you could get caught in the next wave of selling.
Click Here To Join The Next Contest!
See More Trading Strategies From This Contest
AWESOM-0’s Third October Daily Contest Trading Strategy-Contest: October Third Daily Challenge Final Rank: 7 Final Portfolio Value: $101,621.37 (+1.62%) Trading Strategy For This Contest For the October 3rd Daily Contest I picked a mix between triple-leveraged ETFs and a few companies that I felt were undervalued. The triple-leveraged ETFs are great for a daily competition because the profits are huge if Read More...
RUINTHERE’s Third October Daily Contest Trading Strategy-Contest: October Third Daily Challenge Final Rank: 1 Final Portfolio Value: $108,724.97 (+8.72%) Trading Strategy For This Contest The strategy I prefer to use is to look for stocks that have been unfairly beaten down. Many stocks are down at any given time and most justifiably so. However, there are those that have become oversold. Read More...
RiskOn’s October Day Trading Strategy-Contest: October First Daily Challenge Final Rank: 1 Final Portfolio Value: $104,671.33 (+4.67%) Day Trading Strategy For This Contest For this daily contest, I purchased 4 ETF stocks, then sold 2 of them once I had a good lead, not wanting to give up all of my gains. My strategy is to purchase the riskiest Read More...
ksmith’s October Day Trading Strategy-Contest: October First Daily Challenge Final Rank: 3 Final Portfolio Value: $102,112.25 (+2.11%) Day Trading Strategy For This Contest For this day-trading contest, my big winners were the triple-leveraged ETFs (Click Here for a list of leveraged ETFs!) [hq]DWTI[/hq] and [hq]JDST[/hq]. [hq]DWTI[/hq] is a triple-leveraged Bear Oil ETF, so when oil goes down by 1%, Read More...
hoabidebay’s First October Week Contest Trading Strategy-Contest: October First Weekly Challenge Final Rank: 1 Final Portfolio Value: $116,943.82 (+16.94%) Trading Strategy For This Contest I select highly volatile and liquid stocks / ETFs to trade, paying attention to how they behave (gap up/down) the 1st 15 min of the opening session. Final Open Positions and Portfolio Allocation Performance Over The Total Read More...
BranFlakes1212’s October Day Trading Strategy-Contest: October First Daily Contest Final Rank: 6 Final Portfolio Value: $101,341.05 (+1.34%) Day Trading Strategy For This Contest I usually focus on Lower priced stocks because they tend to be more volatile. Tuesday however didn’t have very many stocks doing what I prefer to trade, so I pretty much picked one of the top Read More...
My strategy is finding pharmaceutical/biotech companies. I find corporations that are testing products. I look for ones who have an upcoming announcement on phase 3 testing or FDA approvals. I keep those stocks on my watchlist. Once I see that a stock’s product gets an FDA approval, I would buy it. I usually hold it for no longer than 2 days. These stocks are usually overbought by that point and you’ll anticipate sell-offs. Once I see a weakness in the trend, I would sell it. This weakness in the trend can be seen when the stock breaks down multiple levels of resistance. More than 2 breakdowns and I’m out. Depending on how high it rose, one breakdown may be enough.
Click Here To Join The Next Contest!
See More Trading Strategies From This Contest
AngelRivera’s September Trading Strategy-Contest: September Monthly Million Contest Final Rank: 1 Final Portfolio Value: $1,308,146.64 (+30.8%) Trading Strategy For This Contest My strategy is finding pharmaceutical/biotech companies. I find corporations that are testing products. I look for ones who have an upcoming announcement on phase 3 testing or FDA approvals. I keep those stocks on my watchlist. Once Read More...
smithjjj5’s September Trading Strategy-Contest: Official September Contest Final Rank: 5 Final Portfolio Value: $1,119,202.95 (+11.19%) Trading Strategy For This Contest My strategy is to look for stocks to short that are moving up (30% +)on news with greater than average volume. So much of the time people get overly excited about the news and drive the price higher Read More...
wkaraman14’s September Trading Strategy-Final Rank: 3 Final Portfolio Value: $1,181,543.46 (+18.15%) Trading Strategy For This Contest I used was mainly “gap plays”; I analyze gaps in the premarket everyday, once I determine if the gap will be filled for short term investing, I will place my trade and swing looking for a 10%-20% profit. 90% of all gaps Read More...
“Wall Street” is a street in New York City, near the southern end of Manhattan Island. It is the home of the New York Stock Exchange, and the biggest center of stock trading and finance in the world.
History
Before New York was New York, it was a Dutch colony called New Amsterdam, which only took up a small area in the south of Manhattan Island. As part of the town’s defenses, in the 17th century a wall was built near the town center.
The street build along the wall was called Wall Street, and remained so even long after the walls were torn down and the city continued to grow.
Over time, businessmen began to meet near the old Wall, at a buttonwood tree near the intersection of Wall Street and Broad Street. By 1792, most of the young city’s investors would meet here to trade Revolutionary War bonds, bonds issued by various state and local governments, and a small amount of stocks from the growing businesses in the area.
Wall Street and the United States
Wall Street also had an important government function: in 1700, a new City Hall for New York City was built on Wall Street. As the American Revolution drew near, this building was also where the Freedom of the Press was established (with a lawsuit of the British government against a newspaper printer for libel, he was found not guilty because what he published was true), and where delegates from 9 of the colonies met to draft a letter to King George and the British Parliament in response to the Stamp Act, making the famous claim of “No Taxation without Representation”.
After the Revolutionary War, the city hall became Federal Hall, and served as the capitol of the United States from 1785 until 1789 (where, among other things, the Bill Of Rights was signed). After this, it became a customs house, and later part of the Treasury system. It is now a national monument.
Growing Business
In 1817, the businessmen who had continued to meet near the buttonwood tree to trade Revolutionary and United States bonds (along with small amounts of stocks) pooled their resources to rent an empty building across the street from their old meeting place so they could continue to meet even when it was cold and raining. This building became the first home of the New York Stock Exchange.
Keep Your Students Engaged With A Year Long Stock Game!
If you’ve already used HowTheMarketWorks with your class, you know it can be one of the most fun and engaging part of the year for your students. However, just because your students have finished their unit on personal finance or investment doesn’t mean they can’t keep practicing!
We have been running investment challenges with schools for over 20 years, so here are some tips and tricks to running year long challenges for your class, your grade, or even your whole school! Setting up a year-long challenge is a great way to increase student engagement and make sure your lessons really stick!
Start Early!
It is never too early to set up your stock game! Even if your class challenge is still running, getting your Year Long Challenge started can be a great way to re-engage some of the students who might have fallen behind the class rankings early. Your students can continue to use the same username and password they used for your first class contest, and can easily switch between any other contests they have joined on most pages across the site.
When you register your new contest, you’ll get a link to send your students (just like the first time), if they click this link when logged in, they will join your new contest automatically. They can also find it by searching on the “Join Contests” page.
If you are holding a year-long stock game, try to get other classes involved! The optional contests are a fun way to foster some healthy competition between classrooms, and work well in keeping your own students engaged in the long term. The more students you have join, the more likely the ones who didn’t at first will start to join their friends!
Use Assignments To Encourage Participation!
Assignments are more than just keeping track of your students, they can be a great way to help students who did not participate in your first class challenge to get to know how to use the site and do research (by requiring new students to watch our videos), and you can continue to boost participating by setting assignments to make 5 or 10 trades per week, offering bonus points to students who take part.
You can create unlimited assignments for each contest, so feel free to add a new “Place 5 trades” or “Make 3 limit orders” every week, and just remove the old assignments after the week is over!
Give Incentives!
Prizes and incentives are always a great way to encourage participation! We have two great ways you can encourage students on-site: you can give away one of our T-Shirts, or even just offer certificates to the winners to help!
No Time For A Year-Long Challenge? Mention Our Prized Contests!
We have at least one (and up to 6!) stock games with prizes every month, we gave away over $1,000 to students across the country who finished in the top 5 from our last contest! Our prized contests are usually fairly short – one month to one week – but because there is a new one every month, it can keep students engaged by never being too far behind everyone else!
You can see the details on the next upcoming contest here!
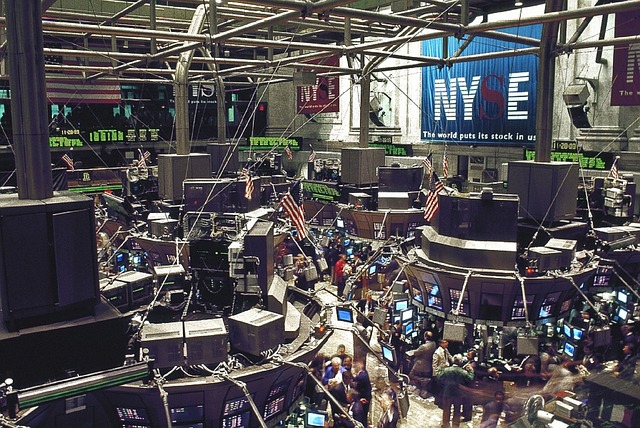
The New York Stock Exchange (or NYSE) is the largest stock exchange in the world. Think of it as an organized, fast-paced flea market where buyers and sellers from all over the world come to trade U.S. stocks (and now some foreign shares as well). It is where over 2,800 of the biggest U.S. companies have their shares listed. On average, over 1 billion shares are traded each day. It is located on Wall Street in New York City.
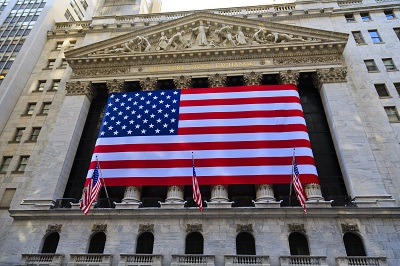
New York stock exchange facade with USA flags
History
Before the New York Stock Exchange became as powerful as it is today, it started as a group of merchants meeting near a buttonwood tree in the late 1700s to trade bonds (from cities, states, and even revolutionary war bonds), and a few stocks from the growing businesses in New York City. These merchants met near the intersection of Wall Street and Broad Street until they pooled their resources in 1817 to rent a building on Wall Street so they could continue to meet and get out of the cold and rain. This building became the first New York Stock Exchange (NYSE).
During the 1800s, the industrial revolution began sweeping across the country and the NYSE was at the center of financing its growth. Thousands of businesses were started and needed access to cash to finance their growth. Many of them sold stock on the NYSE to raise capital to build factories and expand. The first half of the 19th century also saw a huge boom in canal building; canal construction was financed usually partly through government funding (which was raised by selling bonds) and by selling stock in the canal companies to investors (which was sold in stock that paid dividends based on the canal tolls once completed). By the 1840s, canal companies were replaced with railroad construction, which was almost entirely funded by the sale of stock.
It was during the railroad boom that the NYSE transitioned from being centered around bond trading to being mostly focused on the buying and selling of stock. However, it was not just because of the railroads that this transition took place: the invention of the telegraph allowed the news of stock prices to reach investors immediately, rather that waiting for newspapers and other publishers to compile lists at the end of the day or week (which often would not include anywhere near all of the stocks currently on the market). This also allowed buyers and sellers across large distances to trade relatively easily, since it could be done through brokers in respective cities who specialized in trading.
The industrialized companies with their huge growth (and so potentially very valuable stocks) were the biggest reason investors on Wall Street began to move into stock trading rather than bonds. With a bond, the yield is usually based on the likelihood that whoever is borrowing the money will “default”, and fail to pay it back. Stock prices are based on the expected future profits of the business they represent ownership of. Before the industrial revolution, most businesses outside of very large trading organizations grew very slowly and usually did not issue any public stock at all. For most investors, buying bonds was either risky (because of a risk of default) or had fairly low yields, and was the only option available. Industrial companies often promised big growth and big profits, and were eager to sell shares to the public to raise capital quickly (so they could start business faster), encouraging new investors to take part. The huge boom of growth in canal and rail stocks carried over to other industries, and has grown ever since.
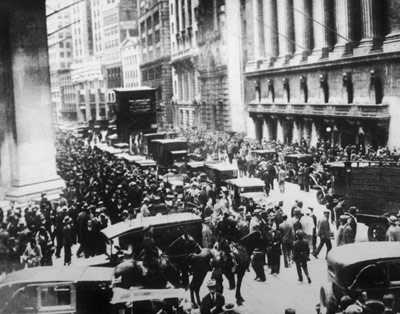
The NYSE was the center of some of the most important economic events in the United States, including the extremely well-known “Black Thursday” in 1929, which is one of the events that started the Great Depression.
The NYSE Today
The NYSE is still the largest stock exchange in the world, and will likely continue to be for a very long time. Traders from around the world still meet to trade on the NYSE floor, but as more and more trading by large financial firms is done completely electronically, and more individuals are trading stocks using their online brokerage accounts, the NYSE and Wall Street act as a global symbol for investment and the financial world.
When starting a business, the business structure usually falls into one of three categories: a sole proprietorship, a partnership, or a corporation. In this intro to stocks, you’ll learn the basics of the different kinds of business structures, and how stocks are issued to help raise capital for business expansion.
A proprietorship is the simplest and has just one owner, a partnership generally has 2 or more partners that reach an agreement as to their responsibilities and ownership percentage. Businesses that incorporate create a separate legal entity (a corporation) and then issue share certificates (stocks) to show who owns how many shares of the corporation.
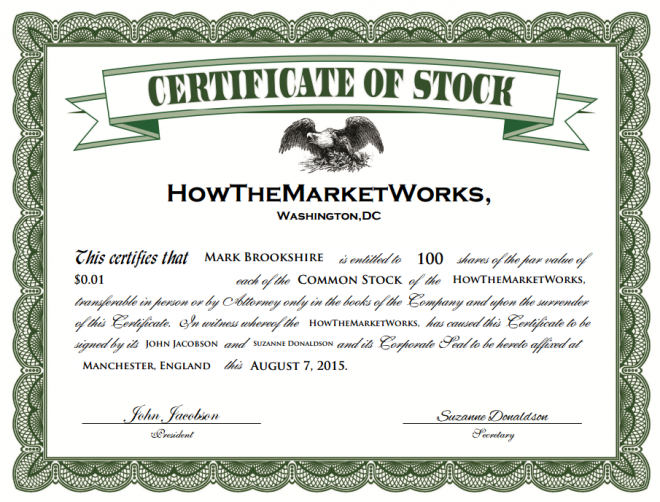
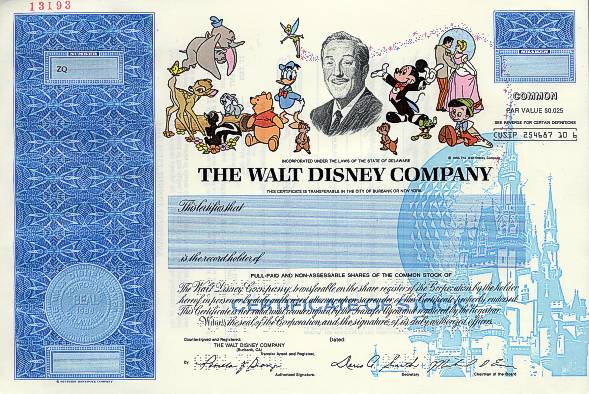
Corporations usually start off small with just a few shareholders. For example, a corporation when it is formed could issue 100,000 shares of stock. The person with the business idea may put in $50,000 of his own money, and then ask his first 5 employees to each put in $10,000. This business would then have 6 shareholders: the founder would have 50,000 shares, and each of the 5 employees would own 10,000 shares.
As corporations grow, they often find they need to raise more money and get a lot more investors. They often turn to Wall Street to help them raise more money by selling more shares of the company. If you bought 100 shares of a company you might get a stock certificate like the one above indicating your ownership.
If you decided you no longer wanted to own those shares you could try to sell them to another investor that might want to own part of that company. This is the essence of the stock market–it is where investors invest in new companies, or they buy and sell (or exchange) shares if they can agree on a fair price.
New York stock exchange facade with USA flags
Pro tip: There are many stock picking services which will help you find the BEST stocks to invest in. Check out this review of the Motley Fool’s Service.
Definition
A stock is defined as a share of ownership of a company; if you own a company’s stock, you actually own a percentage of the company itself (including its assets, like chairs, vehicles, and buildings) and a percentage of its profits.
People invest in companies that they think will be profitable with the hope that the company will start paying out its profits to its shareholders. Likewise, if the company was not profitable and decided to close, then the company might just sell all of its furniture for $1,000 and you would only get $100 back.
For example, if a company issued 1,000 shares and you owned 100 shares, that does not mean that you can go to the company headquarters and take 1/10 of the furniture. It means that if the company was profitable and they made $100,000 and decided to pay it out to the shareholders, you would get 1/10 of $100,000 which is $10,000.
Role of Stock Exchanges
Stock exchanges provide a platform for buyers and sellers to trade shares of publicly listed companies. These exchanges, such as the New York Stock Exchange (NYSE) and the NASDAQ, act as an intermediary between investors and companies. Whether stock trading is happening on a physical trading floor, or through electronic trading systems, the exchanges allow for an efficient settlement process. This means investors can buy and sell shares of companies from around the world. Providing investors access to a wide range of investment opportunities, and allowing companies to raise capital to manage their business operations or for further growth.
In the US, stock exchanges are primarily regulated by government agencies like the Securities and Exchange Commission, (SEC) to ensure they operate fairly and to protect investors from fraud, as well as preventing a stock market crash. To maintain a fair and efficient platform, stock exchanges may suspend all trading or impose a trading restriction on a certain company or ticker symbol if they no longer meet the listing requirements of a publicly traded company. The SEC provides a list of suspended stocks on their website, sec.gov.
Below are some key regulations that help to maintain fair trading on all stock exchanges in the United States.
The Securities Exchange Act of 1934: provides a framework for securities exchanges by authorizing the SEC to regulate and oversee brokerage firms and exchanges.
The Investment Company Act of 1940: this act aims to protect investors through requiring investment companies to provide accurate and timely information about their holdings.
The Dodd-Frank Wall Street Reform and Consumer Protection Act of 2010: this act enhanced consumer protection through increased regulation of financial institutions, including the creation of a new agency called the Consumer Financial Protection Bureau (CFPB) that regulates financial products like credit cards and student loans.
What Does Owning Stock Get Me?
Since you own part of the company, you are now involved in some of its management decisions, and you are entitled to some of the company’s profits. Shareholders often get to vote to choose the Board of Directors, to pick independent accountants, to approve any major change in the company like merging with another company. What exactly you are entitled to depends on the amount of stock that you own. Take the company Apple, for example.
Apple has approximately 5.575 billion shares outstanding, so if you owned 100 shares of Apple, you would own 0.00000179% of the company. That seems like a tiny amount, but keep in mind that Apple makes $50 billion a year so if they paid out all of their earnings one year, you would get $896!
If you decide that you no longer want to own your Apple shares, you can always sell your shares on one of the stock exchanges.
Types Of Stock
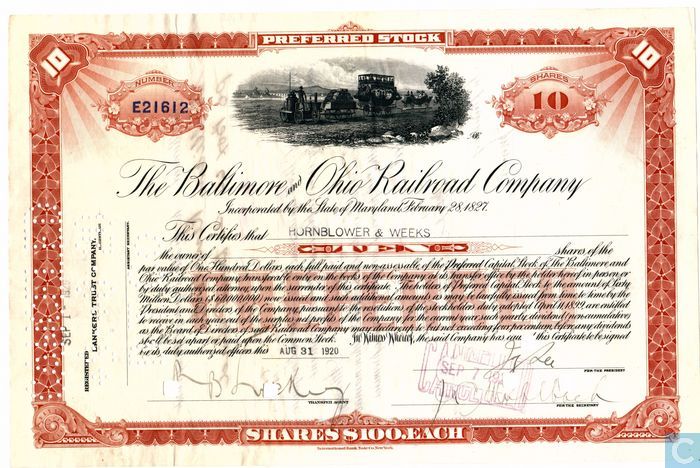
There is more than one kind of stock or ownership that companies sell. While almost all stock traded on the stock exchanges is common stock, some companies have issued preferred stock.
Common Stock
Common stock is the kind most investors buy. Common stock generally gives one vote at shareholder meetings for every share owned. Common stock holders may also be entitled to receive distributions of the companies profits, called dividend payments.
For blue chip stocks, or larger and more stable companies, a portion of corporate profits is usually paid back to shareholders 4 times a year as a dividend. Companies that are still growing usually pay no or very little dividends; but well established companies like utilities generally pay higher dividends.
Preferred Stock
Generally, preferred stocks do not have voting rights, and you won’t find them trading on an exchange. However, preferred stock shares have the benefit of preference for dividend payments; if a company decides it is going to pay dividends, preferred stock holders may get a bigger share, and be paid before common stock holders. Preferred stock holders are also entitled to be paid first if a company goes bankrupt and all the assets are sold off.
The Difference Between Stocks and Bonds
When you buy a stock, you are buying a piece of ownership of a company. A bond, however, is more like a loan or debt; a bond is a promise that a company makes to pay back the amount you lent them plus interest. Hence, if you own a bond, you are only lending a company money, but if you own a stock, you own part of the company itself.
Where Do Stocks Come From?
New shares in a company can come from two places: New Issues and Stock Dividends (or Splits)
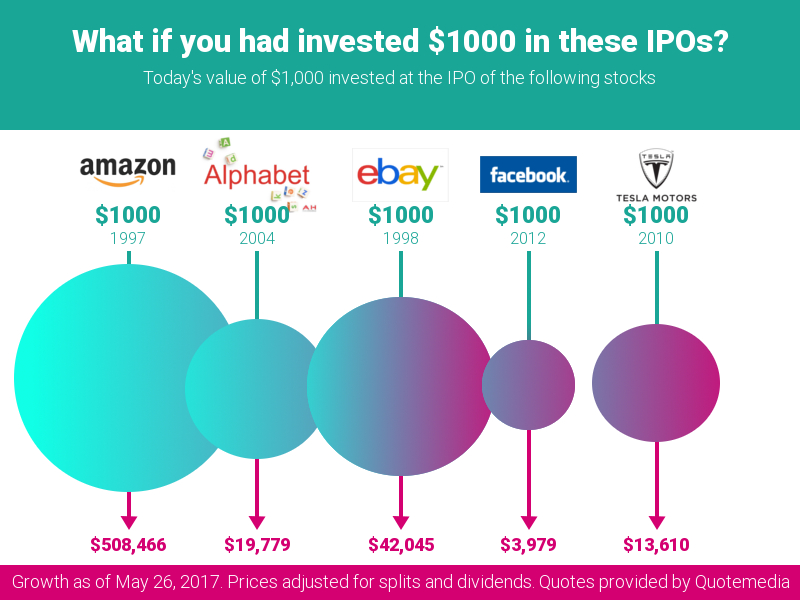
New Issues (Initial Public Offering)
A new issue of stock is when a private company decides to go public, and issues shares of stock for anyone to buy. This is often called an Initial Public Offering, or IPO, and when large private companies go public, it can be a very exciting event with huge fluctuations in the stock’s price in the first weeks while the market decides on a fair price for the shares.
Private companies go public and issue stock primarily to raise money. As they sell the shares in the company, the original owners allow the public to vote on some management decisions in exchange for the cash raised in the stock sale to re-invest and help the company grow.
Stock Dividends (Splits)
Companies may also issue new shares of stock after the IPO. This can be done by giving all current shareholders additional shares in proportion to how many shares they currently have; for example they can say that for every 10 shares you own now, they are issuing you one extra share.
This would be a 10% stock dividend, and the market price for the stocks would drop by 10% (although all shareholders still have the same ‘value’).
If the stock dividend is large enough (usually about 20%), it is instead called a stock split. There are many reasons why companies would want to have a stock dividend or split, but they usually happen for one of two reasons:
Attract Attention and Increase Trading
Companies may split their stock to attract attention to the company through the hype that can come from a stock dividend. However, the simple act of there being more shares in circulation may encourage people to buy and sell more, since each individual share takes up a smaller percentage of a portfolio.
Lower The Price
Some large companies like to have their stock price stay in a certain range. One reason for this is that the more expensive a stock, the fewer people who can afford to buy it (or buy an additional share). So splitting stocks can help it become more affordable, and increase the total value of all stocks in the long run.
Stocks trace their origins back to the Roman Empire, where large, private companies that carried out some public duties would sell shares of stock to Roman citizens for the same reasons companies do today; raise cash and grow their business.
Over the centuries, Joint Stock Corporations were often chartered by monarchs for large projects that the government simply did not want to invest all the cash (and therefore risk) to fund.
For example many canal projects, railroads, and roads in Western Europe were built by Joint Stock Corporations; private investors who were willing to take the risk that a project would fail in exchange for some of the profits if it succeeded.
During the Age of Exploration, joint stock corporations were what funded explorers to voyage across oceans, and later ship goods across continents. The British East India Company is perhaps the most famous of these, which was involved in everything from the exploration of Canada and the Americas to the British conquest of India, and even the slave trade.
https://youtu.be/xxpMsbB8_Ig
How are Stock Prices Determined?
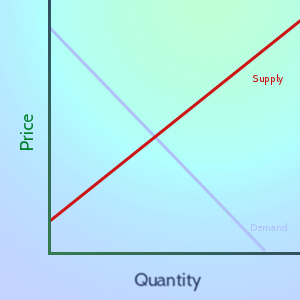
Stock prices are determined by the forces of supply and demand in the financial markets.
When there are more buyers than sellers, demand is greater than supply, and prices tend to rise. On the other hand, when there are more sellers than buyers, supply is greater than demand, and prices tend to fall. This is known as the law of supply and demand, and is the driving force behind the fluctuations in stock prices.
If a company announces in their latest earnings report that there will be major revenue growth, investors may become more optimistic, which often leads to an increase in demand for its shares and a subsequent rise in price. Earnings reports have a significant impact on stock prices. Understanding the impact of earnings report on stock prices will help you time your investments.
Earnings Reports
An earnings report, (a.k.a. quarterly earnings report or quarterly results), is a financial report released by a publicly traded company that summarizes its financial performance for a specific quarter or fiscal year.
The report typically includes information on the company’s financial performance during the reporting period.
Revenue: total amount of money earned by the company.
Net income: profit or loss for the period, calculated by subtracting expenses from revenue.
Earnings per share (EPS): net income divided by the number of outstanding shares, providing a measure of profitability per share.
Gross margin: the cost of goods sold subtracted from revenue, expressed as a percentage.
Operating expenses: includes all expenses, like salaries, rent, and marketing costs.
Operating income: profit from operations, calculated by subtracting operating expenses from revenue.
Cash flow: inflows and outflows of cash during the period.
The report is typically released after the market closes on the scheduled date. If the report shows strong earnings, the stock price may rise as investors become more confident in the company’s future. However, if the report shows weak earnings, the stock price may fall as investors become more cautious about where the company is going. In the short-term, earnings reports are a key driver of price fluctuations. In the longer term, other factors such as economic indicators, interest rates or major global events, (like 9-11) will impact stock prices.
“Beating the Market”
“Beating the Market” is a concept in investing that aims to achieve higher returns than the overall performance of the stock market or a specific benchmark. The most used benchmarks are the S&P 500 and the Dow Jones Industrial Average. For example, if the S&P 500 has a 10% return, and you’re able to reach 12% on your investments over the same time period, then you’ve successfully beaten the market. There are many index funds, or Exchange Traded Funds (ETFs) that track these benchmarks which you can invest in, instead of buying the individual stocks for each company.
Investors want to beat the market because they want to protect their buying power. The stock market is affected by inflation, economic downturns, and changes in interest rates, (among other factors). When inflation is high, the value of money goes down, so investors need to earn higher returns to maintain their purchasing power. Stocks can provide a hedge against inflation by offering a potential for long-term growth that can keep pace with rising prices.
It’s challenging for any investor to consistently beat the market, but if you focus on building a well-diversified portfolio, you should be able to limit the risks of of unpredictable prices on the stock market.
Risks of Investing in Stocks
There are risks associating with investing your money in any type of asset. Although stocks have proven to be one of the best ways of growing your wealth over the long-term, it’s important to understand and manage the risks of investing in the stock market. Below are some of the main risks to look out for as you get started with investing in stocks.
Market Volatility: in the short-term stock markets will change rapidly due to investor sentiment, or how investors are feeling about the direction of a company or industry; as well as trading volumes, or how many investors are actively trading a particular stock. Bull markets (rising prices) mean there is a lot of investor confidence, whereas bear markets (falling prices) mean there is a lot of uncertainty.
Economic Changes: announcements about positive or negative changes in GDP growth, unemployment rates, interest rates or inflation rates will impact how the stock market performs as a whole.
Company Performance: earnings reports (explained above), changes in management, mergers or acquisitions, as well as announcements of dividends or stock splits will impact the price of specific stocks or companies.
Global Events: wars, natural disasters, pandemics, political unrest or other major news can change the direction of prices in certain industries or the markets as a whole.
Regulatory Changes: tax law changes, for instance increases in capital gains tax, or new regulation for financial institutions can change investors’ behavior which leads to changes in all financial markets.
Technological Advancements: technological disruptions happen in every industry, some innovations like artificial intelligence affect all industries, while others like the introduction of digital image processing affected some companies and industries more than others. It’s increasingly important for investors to stay up-to-date on how new innovations will impact the companies in their stock portfolios.
Currency Fluctuations: changes in the value of currencies will impact the prices of international and domestic stocks. For example, if the strength of the US dollar increases, this could have a negative impact on companies that rely on exports as their goods will be more expensive (and less desirable) than goods from countries will weaker currencies.
Mitigating Risks
As a beginner investor, it’s natural to feel nervous about the risks associated with investing in the stock market. However, there are several methods you can use to mitigate these risks and increase your chances of success. One of the most effective ways to do this is by diversifying your portfolio. Check out this article, How to Diversify Your Portfolio to learn more.
Another method is to use stop-loss orders, which is a set of instructions you provide your broker, (online broker or brokerage account) to automatically sell off your shares if the price decreases below a certain threshold. You can learn more about different Order Types and practice setting them up in your HowTheMarketWords account.
Finally, you can limit your risks by keeping a long-term perspective while building and managing your stock portfolio. Though it is tempting to make quick gains through actively buying and selling stocks, you can end up losing money through getting the timing wrong, as well as losing money through taxes and fees.
By understanding the basics of stocks and how the stock market works, you can start investing in stocks to reach your investment goals.
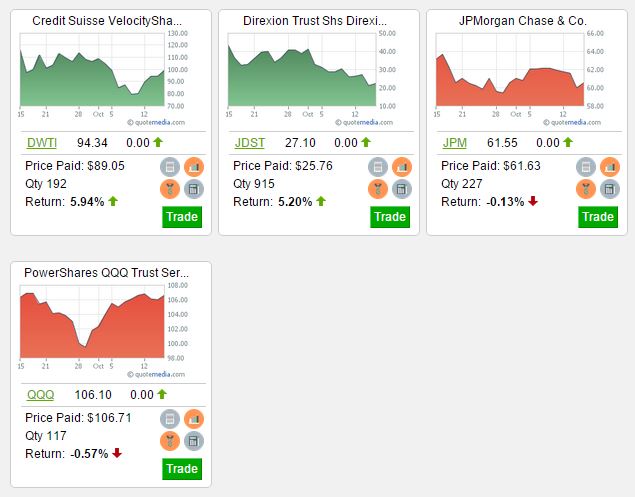
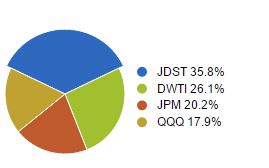
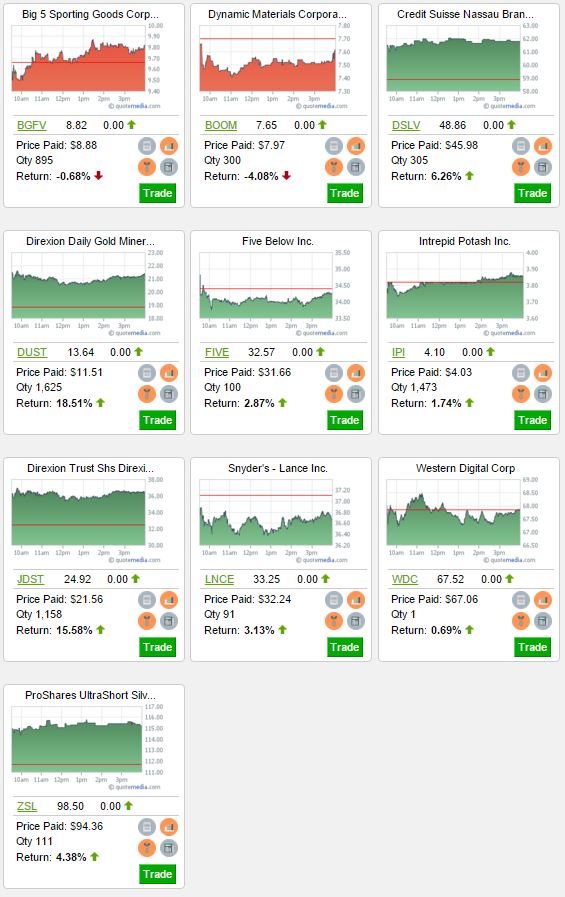
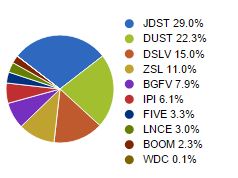
For this daily contest, I purchased 4 ETF stocks, then sold 2 of them once I had a good lead, not wanting to give up all of my gains.
My strategy is to purchase the riskiest 2X and 3X ETF stocks available, use all available cash, and most often enter the market in counter trend at the point where the latest short term market trend appears to be ending. In this way I ride the new trend from the beginning for maximum gain. Once this new counter trend appears to be ending, I will take my profits. There are several tools and algorithms that can be used to predict the beginning or end of a trend. For this contest I used the CCI which is good at predicting an overbought or oversold situation. Warning: This strategy is an extremely risky one, that I would never try in real life with my own money.
Other good strategies for stock picking contests, are to play earnings surprises, or play the big movers of the day.
Final Open Positions and Portfolio Allocation
Click Here To Join The Next Contest!
See More Trading Strategies From This Contest
AWESOM-0’s Third October Daily Contest Trading Strategy-Contest: October Third Daily Challenge Final Rank: 7 Final Portfolio Value: $101,621.37 (+1.62%) Trading Strategy For This Contest For the October 3rd Daily Contest I picked a mix between triple-leveraged ETFs and a few companies that I felt were undervalued. The triple-leveraged ETFs are great for a daily competition because the profits are huge if Read More...
RUINTHERE’s Third October Daily Contest Trading Strategy-Contest: October Third Daily Challenge Final Rank: 1 Final Portfolio Value: $108,724.97 (+8.72%) Trading Strategy For This Contest The strategy I prefer to use is to look for stocks that have been unfairly beaten down. Many stocks are down at any given time and most justifiably so. However, there are those that have become oversold. Read More...
RiskOn’s October Day Trading Strategy-Contest: October First Daily Challenge Final Rank: 1 Final Portfolio Value: $104,671.33 (+4.67%) Day Trading Strategy For This Contest For this daily contest, I purchased 4 ETF stocks, then sold 2 of them once I had a good lead, not wanting to give up all of my gains. My strategy is to purchase the riskiest Read More...
ksmith’s October Day Trading Strategy-Contest: October First Daily Challenge Final Rank: 3 Final Portfolio Value: $102,112.25 (+2.11%) Day Trading Strategy For This Contest For this day-trading contest, my big winners were the triple-leveraged ETFs (Click Here for a list of leveraged ETFs!) [hq]DWTI[/hq] and [hq]JDST[/hq]. [hq]DWTI[/hq] is a triple-leveraged Bear Oil ETF, so when oil goes down by 1%, Read More...
hoabidebay’s First October Week Contest Trading Strategy-Contest: October First Weekly Challenge Final Rank: 1 Final Portfolio Value: $116,943.82 (+16.94%) Trading Strategy For This Contest I select highly volatile and liquid stocks / ETFs to trade, paying attention to how they behave (gap up/down) the 1st 15 min of the opening session. Final Open Positions and Portfolio Allocation Performance Over The Total Read More...
BranFlakes1212’s October Day Trading Strategy-Contest: October First Daily Contest Final Rank: 6 Final Portfolio Value: $101,341.05 (+1.34%) Day Trading Strategy For This Contest I usually focus on Lower priced stocks because they tend to be more volatile. Tuesday however didn’t have very many stocks doing what I prefer to trade, so I pretty much picked one of the top Read More...
For this day-trading contest, my big winners were the triple-leveraged ETFs (Click Here for a list of leveraged ETFs!) [hq]DWTI[/hq] and [hq]JDST[/hq]. [hq]DWTI[/hq] is a triple-leveraged Bear Oil ETF, so when oil goes down by 1%, this ETF goes up by 3%. [hq]JDST[/hq] works the same, but for gold.
With the oil markets so volatile, I knew DWTI, or its partner, [hq]UWTI[/hq], would have some big movement, so I watched the pre-market news and figured prices had a higher chance of going down than up.
For JDST, I always think gold is severely over-valued and love betting against it. I love it even more when that bet pays off!
These leveraged ETFs aren’t very good for long term investments, but if you want to day trade, they can be very interesting choices.
Final Open Positions and Portfolio Allocation
Click Here To Join The Next Contest!
See More Trading Strategies From This Contest
AWESOM-0’s Third October Daily Contest Trading Strategy-Contest: October Third Daily Challenge Final Rank: 7 Final Portfolio Value: $101,621.37 (+1.62%) Trading Strategy For This Contest For the October 3rd Daily Contest I picked a mix between triple-leveraged ETFs and a few companies that I felt were undervalued. The triple-leveraged ETFs are great for a daily competition because the profits are huge if Read More...
RUINTHERE’s Third October Daily Contest Trading Strategy-Contest: October Third Daily Challenge Final Rank: 1 Final Portfolio Value: $108,724.97 (+8.72%) Trading Strategy For This Contest The strategy I prefer to use is to look for stocks that have been unfairly beaten down. Many stocks are down at any given time and most justifiably so. However, there are those that have become oversold. Read More...
RiskOn’s October Day Trading Strategy-Contest: October First Daily Challenge Final Rank: 1 Final Portfolio Value: $104,671.33 (+4.67%) Day Trading Strategy For This Contest For this daily contest, I purchased 4 ETF stocks, then sold 2 of them once I had a good lead, not wanting to give up all of my gains. My strategy is to purchase the riskiest Read More...
ksmith’s October Day Trading Strategy-Contest: October First Daily Challenge Final Rank: 3 Final Portfolio Value: $102,112.25 (+2.11%) Day Trading Strategy For This Contest For this day-trading contest, my big winners were the triple-leveraged ETFs (Click Here for a list of leveraged ETFs!) [hq]DWTI[/hq] and [hq]JDST[/hq]. [hq]DWTI[/hq] is a triple-leveraged Bear Oil ETF, so when oil goes down by 1%, Read More...
hoabidebay’s First October Week Contest Trading Strategy-Contest: October First Weekly Challenge Final Rank: 1 Final Portfolio Value: $116,943.82 (+16.94%) Trading Strategy For This Contest I select highly volatile and liquid stocks / ETFs to trade, paying attention to how they behave (gap up/down) the 1st 15 min of the opening session. Final Open Positions and Portfolio Allocation Performance Over The Total Read More...
BranFlakes1212’s October Day Trading Strategy-Contest: October First Daily Contest Final Rank: 6 Final Portfolio Value: $101,341.05 (+1.34%) Day Trading Strategy For This Contest I usually focus on Lower priced stocks because they tend to be more volatile. Tuesday however didn’t have very many stocks doing what I prefer to trade, so I pretty much picked one of the top Read More...
I select highly volatile and liquid stocks / ETFs to trade, paying attention to how they behave (gap up/down) the 1st 15 min of the opening session.
Final Open Positions and Portfolio Allocation
Performance Over The Total Contest
Click Here To Join The Next Contest!
See More Trading Strategies From This Contest
AWESOM-0’s Third October Daily Contest Trading Strategy-Contest: October Third Daily Challenge Final Rank: 7 Final Portfolio Value: $101,621.37 (+1.62%) Trading Strategy For This Contest For the October 3rd Daily Contest I picked a mix between triple-leveraged ETFs and a few companies that I felt were undervalued. The triple-leveraged ETFs are great for a daily competition because the profits are huge if Read More...
RUINTHERE’s Third October Daily Contest Trading Strategy-Contest: October Third Daily Challenge Final Rank: 1 Final Portfolio Value: $108,724.97 (+8.72%) Trading Strategy For This Contest The strategy I prefer to use is to look for stocks that have been unfairly beaten down. Many stocks are down at any given time and most justifiably so. However, there are those that have become oversold. Read More...
RiskOn’s October Day Trading Strategy-Contest: October First Daily Challenge Final Rank: 1 Final Portfolio Value: $104,671.33 (+4.67%) Day Trading Strategy For This Contest For this daily contest, I purchased 4 ETF stocks, then sold 2 of them once I had a good lead, not wanting to give up all of my gains. My strategy is to purchase the riskiest Read More...
ksmith’s October Day Trading Strategy-Contest: October First Daily Challenge Final Rank: 3 Final Portfolio Value: $102,112.25 (+2.11%) Day Trading Strategy For This Contest For this day-trading contest, my big winners were the triple-leveraged ETFs (Click Here for a list of leveraged ETFs!) [hq]DWTI[/hq] and [hq]JDST[/hq]. [hq]DWTI[/hq] is a triple-leveraged Bear Oil ETF, so when oil goes down by 1%, Read More...
hoabidebay’s First October Week Contest Trading Strategy-Contest: October First Weekly Challenge Final Rank: 1 Final Portfolio Value: $116,943.82 (+16.94%) Trading Strategy For This Contest I select highly volatile and liquid stocks / ETFs to trade, paying attention to how they behave (gap up/down) the 1st 15 min of the opening session. Final Open Positions and Portfolio Allocation Performance Over The Total Read More...
BranFlakes1212’s October Day Trading Strategy-Contest: October First Daily Contest Final Rank: 6 Final Portfolio Value: $101,341.05 (+1.34%) Day Trading Strategy For This Contest I usually focus on Lower priced stocks because they tend to be more volatile. Tuesday however didn’t have very many stocks doing what I prefer to trade, so I pretty much picked one of the top Read More...
I usually focus on Lower priced stocks because they tend to be more volatile. Tuesday however didn’t have very many stocks doing what I prefer to trade, so I pretty much picked one of the top gainers of the day when I thought it would spike back later in the day.
Final Open Positions and Portfolio Allocation
Click Here To Join The Next Contest!
See More Trading Strategies From This Contest
AWESOM-0’s Third October Daily Contest Trading Strategy-Contest: October Third Daily Challenge Final Rank: 7 Final Portfolio Value: $101,621.37 (+1.62%) Trading Strategy For This Contest For the October 3rd Daily Contest I picked a mix between triple-leveraged ETFs and a few companies that I felt were undervalued. The triple-leveraged ETFs are great for a daily competition because the profits are huge if Read More...
RUINTHERE’s Third October Daily Contest Trading Strategy-Contest: October Third Daily Challenge Final Rank: 1 Final Portfolio Value: $108,724.97 (+8.72%) Trading Strategy For This Contest The strategy I prefer to use is to look for stocks that have been unfairly beaten down. Many stocks are down at any given time and most justifiably so. However, there are those that have become oversold. Read More...
RiskOn’s October Day Trading Strategy-Contest: October First Daily Challenge Final Rank: 1 Final Portfolio Value: $104,671.33 (+4.67%) Day Trading Strategy For This Contest For this daily contest, I purchased 4 ETF stocks, then sold 2 of them once I had a good lead, not wanting to give up all of my gains. My strategy is to purchase the riskiest Read More...
ksmith’s October Day Trading Strategy-Contest: October First Daily Challenge Final Rank: 3 Final Portfolio Value: $102,112.25 (+2.11%) Day Trading Strategy For This Contest For this day-trading contest, my big winners were the triple-leveraged ETFs (Click Here for a list of leveraged ETFs!) [hq]DWTI[/hq] and [hq]JDST[/hq]. [hq]DWTI[/hq] is a triple-leveraged Bear Oil ETF, so when oil goes down by 1%, Read More...
hoabidebay’s First October Week Contest Trading Strategy-Contest: October First Weekly Challenge Final Rank: 1 Final Portfolio Value: $116,943.82 (+16.94%) Trading Strategy For This Contest I select highly volatile and liquid stocks / ETFs to trade, paying attention to how they behave (gap up/down) the 1st 15 min of the opening session. Final Open Positions and Portfolio Allocation Performance Over The Total Read More...
BranFlakes1212’s October Day Trading Strategy-Contest: October First Daily Contest Final Rank: 6 Final Portfolio Value: $101,341.05 (+1.34%) Day Trading Strategy For This Contest I usually focus on Lower priced stocks because they tend to be more volatile. Tuesday however didn’t have very many stocks doing what I prefer to trade, so I pretty much picked one of the top Read More...
The October stock contests are finished, with over a thousand participants from all over the world! We had hundreds of thousands of trades placed, and already gave away almost $1000! See who won below!
First Weekly Contest
The Top 5 performers by portfolio value were:
hoabidebay+16.94%
kingsalman+14.36%
brucehaan+14.08%
daniellopez+10.16%
Housemanager+9.83%
The HTMW Team Finishers were:
ksmith+0.89%
Rossman-0.45%
gbrown-5.45%
First Daily Contest
RiskOn+4.67%
LanguageMan1+3.56%
ksmith+2.11% – Not Eligable For Prizes
msr13029+1.76%
LGarciap03+1.60%
alexanderkrauss16+1.42%
The HTMW Team Finishers were:
ksmith+2.11%
gbrown-0.01%
Second Daily Contest
hoabidebay+4.43%
kingsalman+2.63%
Housemanager+2.59%
AWESOM-O+2.54%
valios+2.26%
The HTMW Team Finishers were:
ksmith-1.36%
psimard-1.36%
gbrown-1.93%
Second Weekly Contest
2018049n+8.72
cscanlon2013+7.57
Roboman+7.48
prayerwarrior8507+7.41
ttietze+5.51
The HTMW Team Finishers were:
gbrown+0.08%
ksmith-7.40%
Third Daily Contest
RUINTHERE+8.72%
RiskOn+3.16%
NicholasSarkozy+1.84%
htngoog+1.68%
remaleyc+1.68%
MrHenderson125+1.67%
AWESOM-O+1.62%
dsalkov+1.50%
prayerwarrior8507+1.49%
dancegirl+1.45%
Fourth Daily Contest
Lschool14+3.09%
LanguageMan1+3.06%
2016046h+2.00%
Spacebounduniverse+1.83%
MichaelGebhart+1.68%
moneyman2000+1.43%
smithjjj5+1.33%
2018049n+1.27%
Dclep13+1.24%
JohnHOQ+1.23%
See The Trading Strategies From This Contest!
AWESOM-0’s Third October Daily Contest Trading Strategy-Contest: October Third Daily Challenge Final Rank: 7 Final Portfolio Value: $101,621.37 (+1.62%) Trading Strategy For This Contest For the October 3rd Daily Contest I picked a mix between triple-leveraged ETFs and a few companies that I felt were undervalued. The triple-leveraged ETFs are great for a daily competition because the profits are huge if Read More...
RUINTHERE’s Third October Daily Contest Trading Strategy-Contest: October Third Daily Challenge Final Rank: 1 Final Portfolio Value: $108,724.97 (+8.72%) Trading Strategy For This Contest The strategy I prefer to use is to look for stocks that have been unfairly beaten down. Many stocks are down at any given time and most justifiably so. However, there are those that have become oversold. Read More...
RiskOn’s October Day Trading Strategy-Contest: October First Daily Challenge Final Rank: 1 Final Portfolio Value: $104,671.33 (+4.67%) Day Trading Strategy For This Contest For this daily contest, I purchased 4 ETF stocks, then sold 2 of them once I had a good lead, not wanting to give up all of my gains. My strategy is to purchase the riskiest Read More...
ksmith’s October Day Trading Strategy-Contest: October First Daily Challenge Final Rank: 3 Final Portfolio Value: $102,112.25 (+2.11%) Day Trading Strategy For This Contest For this day-trading contest, my big winners were the triple-leveraged ETFs (Click Here for a list of leveraged ETFs!) [hq]DWTI[/hq] and [hq]JDST[/hq]. [hq]DWTI[/hq] is a triple-leveraged Bear Oil ETF, so when oil goes down by 1%, Read More...
hoabidebay’s First October Week Contest Trading Strategy-Contest: October First Weekly Challenge Final Rank: 1 Final Portfolio Value: $116,943.82 (+16.94%) Trading Strategy For This Contest I select highly volatile and liquid stocks / ETFs to trade, paying attention to how they behave (gap up/down) the 1st 15 min of the opening session. Final Open Positions and Portfolio Allocation Performance Over The Total Read More...
BranFlakes1212’s October Day Trading Strategy-Contest: October First Daily Contest Final Rank: 6 Final Portfolio Value: $101,341.05 (+1.34%) Day Trading Strategy For This Contest I usually focus on Lower priced stocks because they tend to be more volatile. Tuesday however didn’t have very many stocks doing what I prefer to trade, so I pretty much picked one of the top Read More...
About The Challenge
The September Monthly Million Challenge is the first in our Monthly Million series, with over a thousand participants from all over the world! The rankings were fierce, with the HowTheMarketWorks team scattered throughout, but you’ll be surprised who won!
If you missed out, you can get the details on our latest monthly challenge, where you can win cash prizes by learning about investing, on our Contests Page (Click Here)!
Rules
There will be a full audit at the end of the competition on all winners to verify any corrections due to stock splits, dividends, or any other corporate action our team may have missed. Only legitimate portfolio returns will be counted in the ranking.
The usernames of the winners will be made public, but not their actual first name, last name, nor email address.
No member of the HowTheMarketWorks Team is eligable for any prizes
Other Prized Contest Results
Fall 2017 Challenge-Win prizes in our stock market contests! Find all of the information for any stock contests with prizes we are currently running here! You can also find information on past contests and their winners. Register Here To HTMW Fall Challenge Who can join? Anyone can join! Joining our stock market contests is completely free, so Sign Up Read More...
Back To School Challenge-Our Back To School Challenge is now finished, we had tens of thousands of trades placed to fight for the top spots! See the winners below! If you want a shot at a cash prize yourself, join our next contest! Click Here To Join The Next Contest! Stock Trading Contest Result Fractals7 Namburiv Catspaws Igorski123 Read More...
April Trading Contest-Our April Trading Contest is now finished, we had tens of thousands of trades placed to fight for the top spots! See the winners below! If you want a shot at a cash prize yourself, join our next contest! Click Here To Join The Next Contest! Stock Trading Contest Result TJack43 EddieB18 Housemanager brucehaan wolforda17 About Read More...
March Trading Contest-Our March Trading Contest is now finished, we had tens of thousands of trades placed to fight for the top spots! See the winners below! If you want a shot at a cash prize yourself, join our next contest! Click Here To Join The Next Contest! Stock Trading Contest Results MichaelGebhart +53.77% wpeldiak +50.55% Janene +31.00% Read More...
February Trading Contest-Our February Trading Contest is now finished, we had tens of thousands of trades placed to fight for the top spots! See the winners below! If you want a shot at a cash prize yourself, join our next contest! Click Here To Join The Next Contest! Stock Trading Contest Results almater1 +44.59% Housemanager +43.9% Michael +35.1%% Read More...
January Stock Trading Contest-Our January stock trading contest is now finished, we had tens of thousands of trades placed to fight for the top spots! See the winners below! If you want a shot at a cash prize yourself, join our next contest! Click Here To Join The Next Contest! Stock Trading Contest Results smithjj5 +30.19% blowke +28.64% qtran12203 Read More...
December Stock Trading Contest-Our December stock trading contest is now finished, we had tens of thousands of trades placed to fight for the top spots! See the winners below! If you want a shot at a cash prize yourself, join our next contest! Click Here To Join The Next Contest! Stock Trading Contest Results smithjjj5 – +36.28% Return mchung37 Read More...
November Investing Contest Results-Our November investing contests are now finished, we had tens of thousands of trades placed to fight for the top spots! See the winners below! If you want a shot at a cash prize yourself, join our next contest! Click Here To Join The Next Contest! First Weekly Contest blowke +15.56% Second Weekly Contest brendanriley +15.41% Read More...
October Stock Contest Results!-The October stock contests are finished, with over a thousand participants from all over the world! We had hundreds of thousands of trades placed, and already gave away almost $1000! See who won below! First Weekly Contest The Top 5 performers by portfolio value were: hoabidebay +16.94% kingsalman+14.36% brucehaan +14.08% daniellopez +10.16% Housemanager +9.83% The Read More...
September Monthly Million Challenge!-The September Monthly Million Challenge is the first in our Monthly Million series, with over a thousand participants from all over the world! The rankings were fierce, with the HowTheMarketWorks team scattered throughout, but you’ll be surprised who won! The Top 5 performers by portfolio value were: AngelRivera +30.81% Janene+23.14% wkaraman14 +18.15% puttno2 +12.63% smithjjj5 Read More...


 It is never too early to