***Motley Fool Stock Advisor Performance Updated as of November 9, 2024***
Does the Motley Fool’s Stock Advisor newsletter provide good stock recommendations and is it worth the price?
At HowTheMarketWorks, one of the services we provide our users is that we subscribe to dozens of stock advisory services and we buy all of the recommended stocks from each service in a virtual trading account.
This allows us to have objective performance results of each service.
In this article I will review the performance of the Motley Fool Stock Advisor stock picks from years 2016 through 2024, and show you the profitability of all these stock picks. You’ll get to see: Is the Motley Fool legit? Is the Motley Fool worth it? Or is this stock picking service a scam?
I will show you some of the Motley Fool stock picks that were excellent stock picks and gave us huge profits. I will also show you how we used stop-loss orders to protect our initial capital.
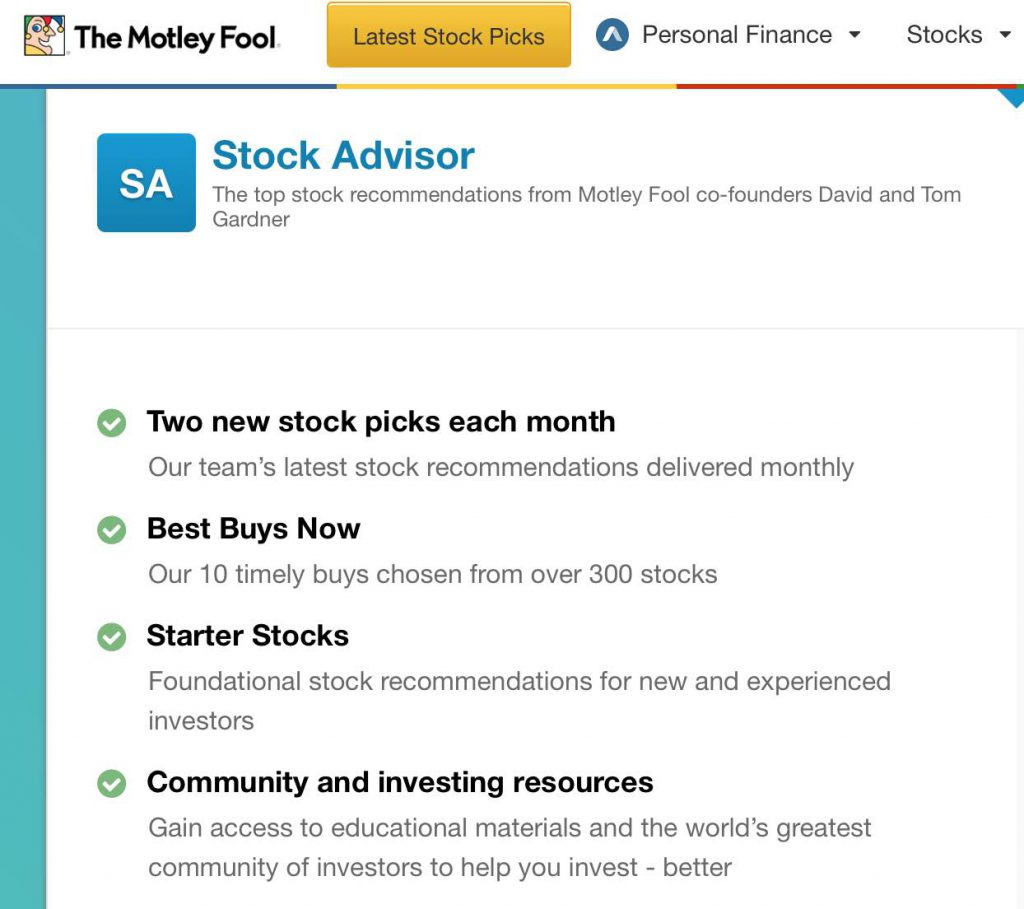
Here are the 4 main things you get when you buy the Motley Fool Stock Advisor service. This is directly from the Motley Fool’s webpage:
Motley Fool Background
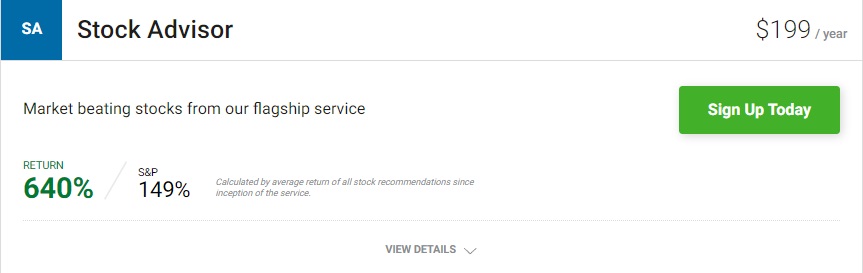
The Motley Fool has been providing stock market commentary and specific stock recommendations to the general public since 1993. They truly exist to help you make money in the stock market. Currently they offer about a dozen stock recommendation newsletters that cover a variety of investment strategies. The price for these stock advisory services ranges from $199 a year to $13,999 a year for full access to all Motley Fool stock services.
The Motley Fool Stock Advisor is their most popular service and their most affordable. Their marketing page says it has over 500,000 subscribers.
Their office is located in Alexandria, Virginia. I have even been to their offices several times over the 30+ years I have been in the stock market education business. As of 2024, the Motley Fool has over 700 employees.
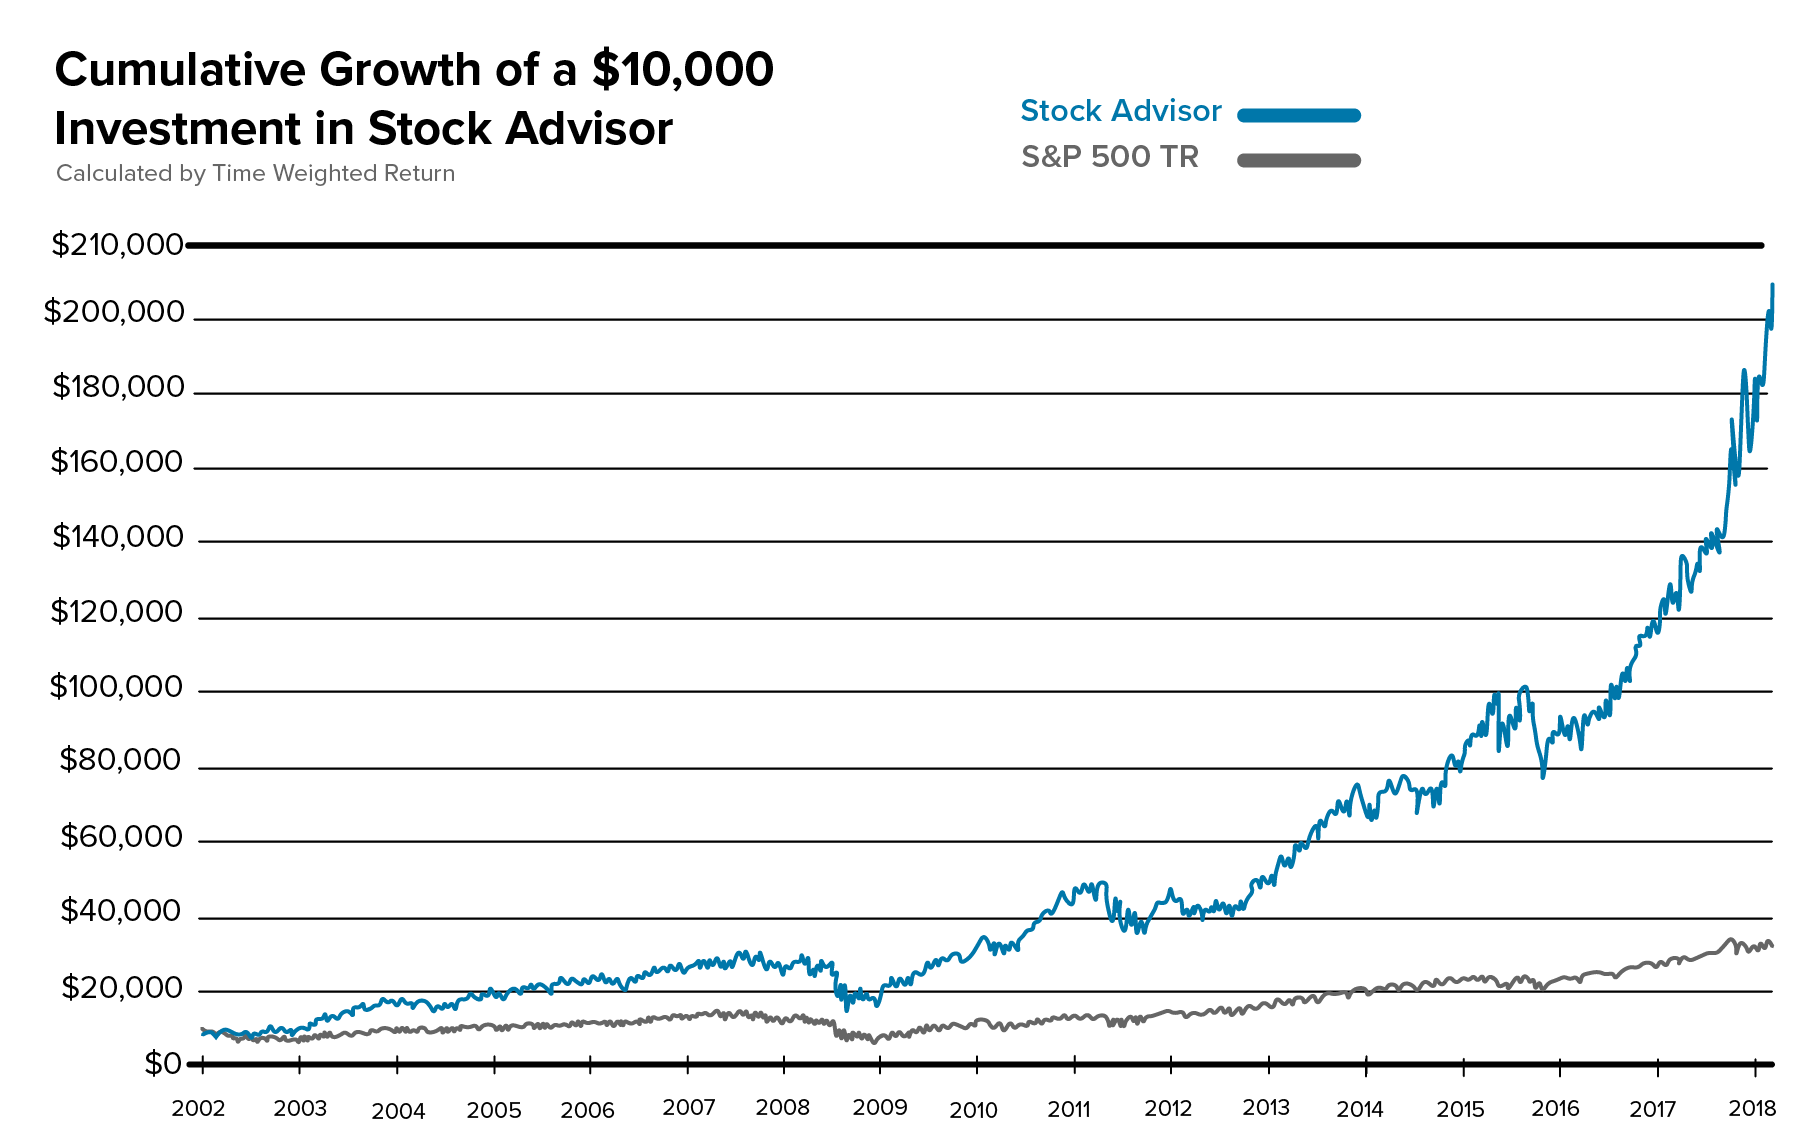
The Motley Fool’s “Stock Advisor” newsletter is their most popular and their most advertised stock picking newsletter.
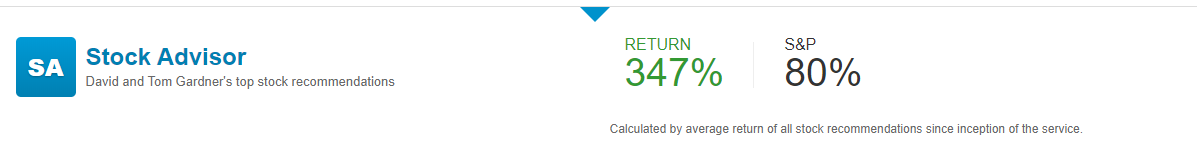
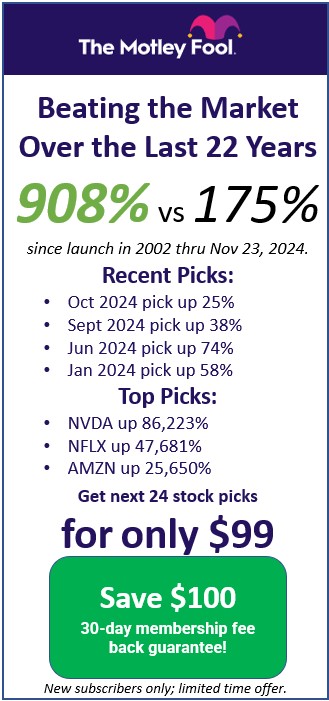
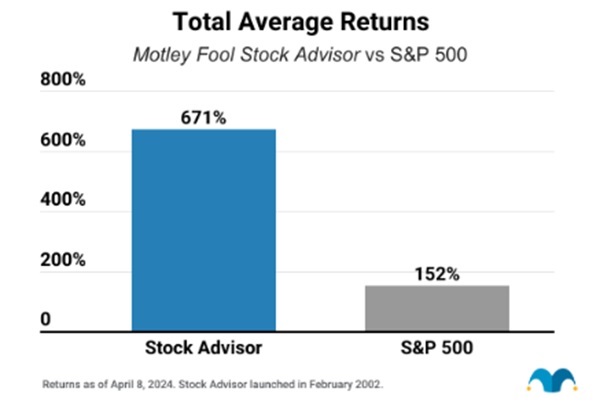
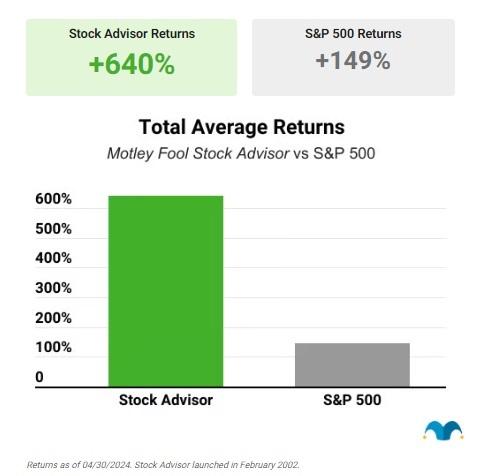
They claim this service has returned 908% versus the SP500’s 175% since the Stock Advisor’s launch in 2002 (as of November 23, 2024). See their latest ad below…
My Motley Fool Stock Advisor Performance
With the Motley Fool Stock Advisor newsletter they send you two NEW stock recommendations each month. You will also get updates on previous recommendations, and occasionally a few sell recommendations. The emails are short and concise, and if you want to click to get more information, you can read their full analysis.
This Motley Fool Stock Advisor Performance is based on my own experience as a subscriber since January 2016. At 2 picks a month for 98 months that is 196 stock recommendations.
Here is a table summarizing the performance of those 196 stock picks:
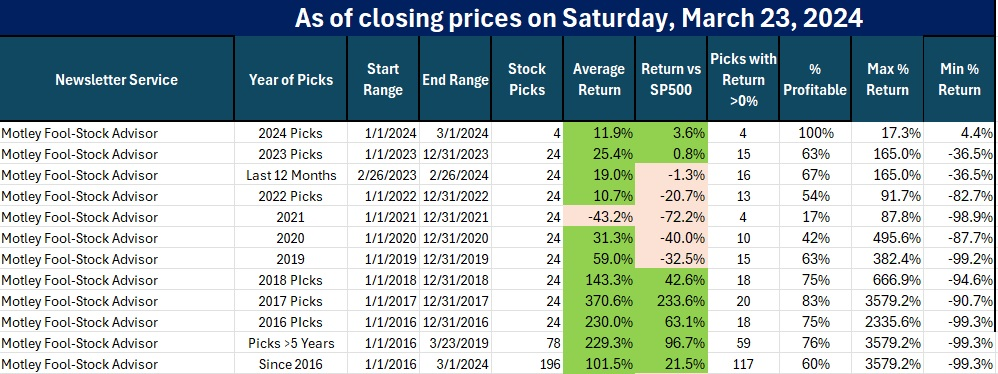
Summary of the Motley Fool Results
As of the date noted above, here are the highlights of the Motley Fool Performance for the last 8 years:
- 83% of the Motley Fool stock picks were profitable
- the average return of their 120 stock picks is 215% vs the market’s 80%
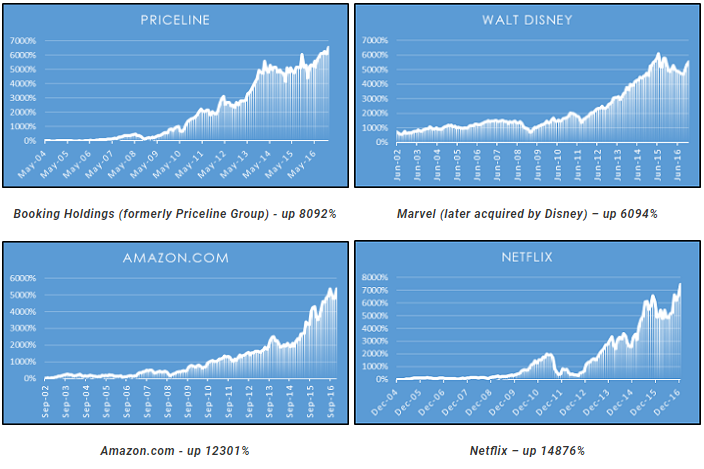
- they achieved that incredible average by picking many stocks that have doubled and tripled:
- 55 of those 120 stocks at least doubled
- 37 of those 120 at least tripled
- 23 of those 120 at least quadrupled
- one of their 2016 stocks is up 4535% (Shopify)
The Motley Fool really does have a great knack for finding a few stocks each year that have fantastic returns. Think about it. If you buy 24 stocks a year, lose 8% on 4 stocks, make 10% on 16 of them, have 2 that double and 2 that triple, your portfolio will be up 30% in one year. In 3 years you will double your portfolio. That is essentially what the Motley Fool Stock Advisor has done for the last few years.
More About My Experiment
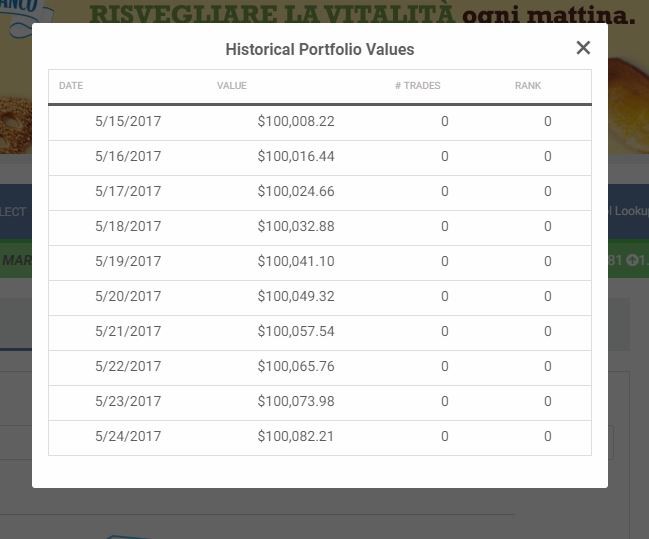
Since I work for HowTheMarketWorks, at first I set up a virtual Motley Fool account with $100,000 and just started buying $5,000 of each of the stocks they recommended. Like most of you, I am a busy person. I can’t always stop what I am doing when I get their emails. Generally I would place my buy orders as a market order within an hour or 2 after getting the Motley Fool stock picks. I have been burned (ie, lost money) from other stock services. So to be cautious, I placed a stop loss order at 30% below my purchase price.
After seeing the positive returns on 8 of the first 10 buy recommendations that I paper traded in my HowTheMarketWorks account, I decided to start buying the Motley Fool stock picks with my real brokerage account using my real money. At first I started buying $2,000 of each of their stock recommendations. I have to say that I am very, very pleased with the results. I just wished I had more money to buy more of their picks!
For their 2020 stock picks which on average are up 83%, 17 of those 24 are up as of August 13, 2021. Here are some of their specific recommendations:
- January 2020 stock pick TSLA is up 733%
- February 2020 pick DXCM is up 62%
- March 2020 ZM is up 187%
- April 20200 pick SHOP is up 332%
- June 2020 stock pick CRWD is up 154%
- July 2020 pick ASML is 106%
Obviously these are just some of the recent Motley Fool stock picks. My point of showing you these is that they really do pick stocks that double and triple each year. And THAT is how they have made the amazing returns they advertise.
In addition to the 2 picks per month, they also send out a few other BUY lists like this one…
Here is a sample email that they sent in May 2018 of their Starter Stocks recommendations. Here are 10 solid stocks. I am showing you a 2018 email because the Motley Fool investing philosophy is that they recommend you hold their stock picks for at least 5 years.
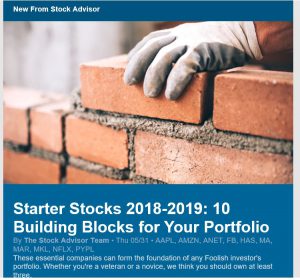
Motley Fool Stock Advisor Sample Email
Of those 10 stocks (AAPL, AMZN, ANET, FB, HAS ,MA, MAR, MKL, NFLX, PYPL), they have all gone up since I received that email.
The cost of the Motley Fool Stock Advisor has fluctuated over the years from as low as a few hundred dollars to $995 a year. Right now they show the price at $199 a year, but are currently offering 12 months for only $99 to new subscribers.
*** THE BEST STOCK NEWSLETTER OF 2020 -- March 1, 2021 UPDATE --
We are constantly monitoring over a dozen stock recommendation and advisory newsletters. There is one newsletter that is consistently outperforming all of the others and that is The Motley Fool Stock Advisor.
The BEST newsletter of 2020 was the Motley Fool Stock Advisor service who had 22 of 24 profitable stock picks with an average return of 89%, including 7 picks that more than doubled.
Most impressively, over the last 5 years that we have been tracking every recommendation, their average stock pick is up 201% compared to the the SP500's 53%. That means the Motley Fool is almost 4x better than the market! No other stock newsletter comes close to that. The Fool has done so well because they quickly identify stocks that will perform well BEFORE everyone else does. Now with a new President and a COVID vaccine, make sure you get their next stock pick!
Take a look at these recent picks as of March 1, 2021:
- Their December 3, 2020 pick is already up 80%
- Their November 5, 2020 picks is up 56%
- October 1, 2020 pick is already up 84%
- Fiverr Intl (FVRR) -- September 2, 2020 pick is already up 135%
- CrowdStrike (CRWD) -- June 4, 2020 pick is already up 132%
- ServiceNow (NOW) -- May 7, 2020 pick is already up 54%
- Shopify (SHOP) – April 2, 2020 pick and it is already up 271%
- Zoom Video (ZM) – March 19, 2020 pick and it is already up 239%
- DexCom (DXCM) picked Feb 20, 2020 right before the market crashed and it is still up 35%
- Tesla (TSLA) picked January 2, 2020 before the crash and it is up 890%
- HubSpot (HUBS) picked December 5, 2019 and it is up 170%
- Netflix (NFLX) picked November 21, 2019 and it is up 76%
- Trade Desk (TTD) picked November 7, 2019 and up 343%
- SolarEdge (SEDG) picked September 19, 2019 and it is up 244%
Now, no one can guarantee that their next picks will be as strong, but our 5 years of experience tracking the Fool shows that their picks are doing better than ever.
Normally the Fool service is $199 per year but there is a special offer page where NEW SUBSCRIBERS can try it for just $99/year if you click this link.
Updated as of April 11, 2021 -- The Motley Fool Stock Advisor service has won our award for the Best Stock Newsletter of 2020--that's now four years in a row. The Motley Fool 2020 stock picks have a 78% return and 20 of those 24 stock picks were profitable. FIVE of those 24 stocks have now at least DOUBLED! TSLA was their top pick and is now up 687% since they recommended it in January 2020. Also their 2019 stock picks are now up 115% compared to SP500's 47%; and their 2018 stock picks are up 209% compared to SP 58%. Now with a new President and a COVID vaccine that seems to be working, most analysts expect the market to continue up. But make sure you have the right stocks in your portfolio so you can CRUSH THE MARKET like their last 5 years of stock picks have done!
In fact, over the last 5 years the average Motley Fool stock pick has almost tripled, being up 192%! This time period covers the 2016 election, the Trump administration, the China trade negotiation, COVID, and now the Motley Fool is continuing their excellent stock picks with one of their 2021 stock picks already up 23%. Don't miss out on the Motley Fool's next stock pick. Here is their schedule for the next few weeks:
- April 15, 2021 - David's New Stock Recommendation
- April 22, 2021 - David's List of 5 Best Stocks to Buy Now List
- May 6, 2021 - Tom's New Stock Recommendation
- May 13, 2021 - Tom's List of 5 Best Stocks to Buy Now
FYI--Their October and November picks are already up 92%, 18%, 29% and 41%. And remember, if you are not impressed, you can always cancel within 30 days and get a full refund.
CLICK HERE to get the next 24 Motley Fool's Stock Picks for just $99 per Year!
Other Considerations
If you subscribe to the Motley Fool Stock Advisor, you might find yourself making more stock trades than you normally do. So be careful of the commissions you pay with each trade. Commissions will eat up your profits if you are only investing a few hundred or thousand dollars.
If you don’t already have a real stock brokerage account, then open a new account and take advantage of the special “Commission Free” offers that a lot of the brokers have right now. To review all of the “Commission Free” stock broker offers for new accounts, CLICK HERE.
If you already have a brokerage account, don’t be shy to switch brokers or open a second or third account. I have 4 brokerage accounts myself. It has literally saved me thousands of dollars! I have 4 brokerage accounts for a reason. I take advantage of special offers to trade commission free, and you should too. A penny saved is a penny earned.
Also be warned, the Motley Fool business model is they use this service as their entry level subscription service. Once they have your email address, they try to upsell you to their other services. They don’t call you, they just send you emails. So I don’t find them annoying at all.
Final Thoughts
Some people ask me if the Motley Fool is a legitimate business. Yes, absolutely they are legit and they are there to help you make money. I have visited their offices in Alexandria, VA several times. I have met several of their key personnel and I see them at investor education conferences. They take their job seriously and are truly focused on helping their subscribers make money in the stock market. If you are ever unhappy, you can always cancel. And yes, when you call they will answer their phone! If you want to know how it rates against other stock picking services, then read this best stock newsletters.
My Conclusion
The Motley Fool Stock Advisor service is the best value for the money.
Don’t just take my word for it, feel free to read this other Motley Fool review.
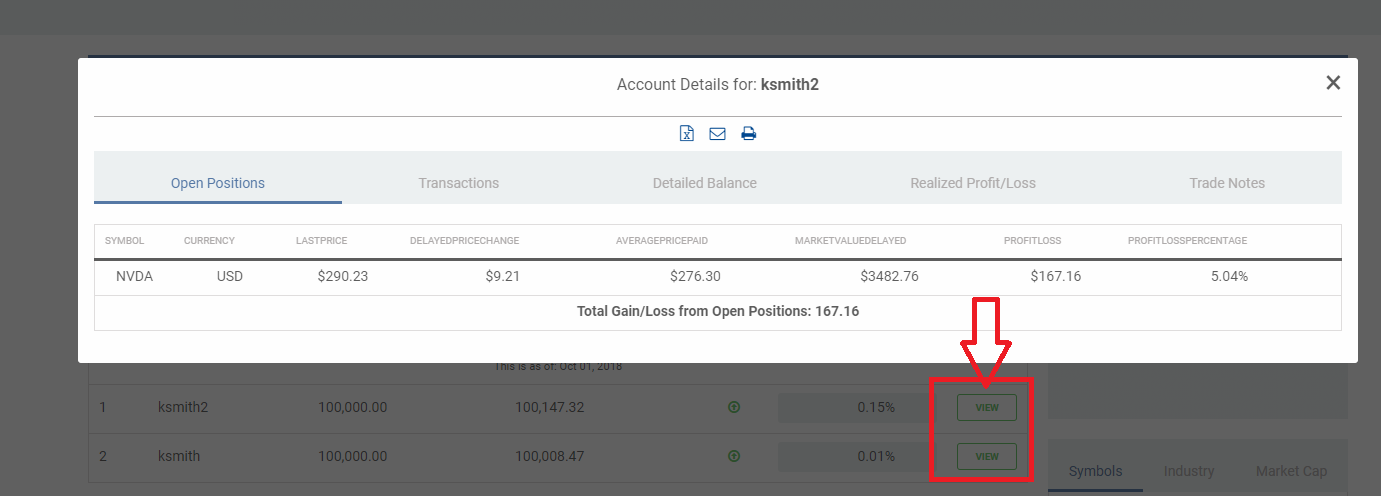
If you are just getting started investing in the stock market, or even if you have been managing your stock portfolio for years, the Motley Fool Stock Advisor is a great service for the money. I never would have bought SQ, MAR and NVDA without their recommendations. If you want to try the service, click on the link below…
How to Order the Motley Fool Stock Advisor and Save…

The Stock Advisor newsletter is currently available to new subscribers for $99 for 12 months. At this price it is a NO-BRAINER to spend $99 and get their next 12 months of stock picks and market commentary. All of their stocks will probably NOT go up. From my experience, however, most will go up over the long term. Most importantly, they seem to have a way of finding stocks that double or triple in a year. Stocks like NVDA, MAR, AMZN, and SQ did that for me. It’s always great to have a few stocks that double in a year to offset a few of their losing picks..
How Do I Open a Robinhood Account and Get up to $1,700 in FREE STOCK?
To open a Robinhood account, all you need is your name, address, and email. If you want to fund your account immediately, you will also need your bank account routing and account number.
As its current promotion, Robinhood is giving away a FREE STOCK (valued at $5 to $200) to anyone that opens a new account this month if you click on the promo image below. Then, once you open and fund YOUR account with at least $1, you will receive more free stock (again valued at $5 to $200) for referring your friends and family. The more people you refer, the more free stock you get. Click on this promo below to start your Robinhood account application and get your first FREE stock.....
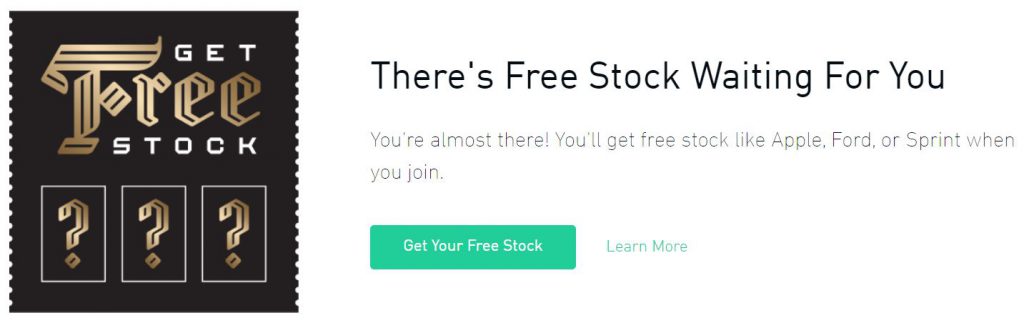
Bonus Tip: Use this link to get a free stock (up to $200 value) when you open and fund your account with at least $1 and start investing in stocks, options and cryptos: sign up for Robinhood today, you'll get a free stock (up to $200 value!) FURTHERMORE, for each friend that you refer, you will receive ANOTHER free stock valued at up to $200. This is perfectly legit and you WILL get more free stock for every friend or family member you refer.
Why do they give away so much free stock? Because they spend their advertising dollars this way instead of buying TV, radio, print, or online ads! They WANT you to refer friends!
[noad]